All About Public-Use Microdata Areas (PUMAs)
Revised October 2022
Overview
Public use microdata areas (PUMAs) are statistical geographic entities created by the U.S. Census Bureau for use with its public use microdata sample (PUMS) data releases.
Defining PUMAs
- PUMAs have populations of at least 100,000.
- PUMAs are defined for each state and do not cross state boundaries.
- PUMAs cover the entirety of the U.S. without any gaps, "holes", or overlaps.
- PUMAs comprise contiguous counties (or county equivalents) and/or tracts. Large urban counties are typically subdivided into multiple PUMAs; in less-populated rural areas, PUMAs often combine multiple counties.
PUMAs are redefined every ten years in conjunction with the decennial census. The U.S. Census Bureau partners with state data centers (SDCs, such as MCDC) to delineate PUMA boundaries for each state. New PUMAs are released about two years after the decennial census — the 2010 PUMAs were released in 2012 and the 2020 PUMAs in 2022. (On the MCDC website, the census year and PUMA release year are used interchangeably.)
Purpose and History
The PUMA geography type was created specifically for use with public use microdata sample (PUMS) data, also called microdata, which contains individual records of the characteristics for a sample of persons and households. The Census Bureau has published PUMS data for every census since 1960, but PUMAs were first used for reporting PUMS data in the 1990 census. (Before 1990, PUMS data were reported for states, counties, and metro areas.)
For the 1990 and 2000 decennial censuses, two types of PUMAs were defined for reporting PUMS data. "1%" or "super" PUMAs were larger (metro areas or county groups in 1990; population >= 400,000 in 2000) and were used to report the 1% sample microdata. The 5% PUMAs, used to report the 5% sample data, were required to contain a minimum population of 100,000 persons, and had to nest within states.
Beginning with the American Community Survey (ACS, established in 2005) and the 2010 decennial census, the 1% (super) PUMAs were no longer used. The 5% PUMAs are the ones that are used today. On the MCDC website and in this document, the term PUMA almost exclusively refers to these 5% PUMAs. Also beginning in 2010, PUMAs were assigned names, usually determined by SDCs participating in the PUMA boundary definition program.
Coding
PUMAs are assigned five-digit codes that are unique within each state. Typically, larger (county or multi-county size) PUMAs have codes that end with "00". PUMAs that represent portions of a large-population county will have the same first three digits, with the last two digits assigned as "01", "02", etc. For example, St. Louis County contains eight PUMAs, numbered 01901 through 01908. PUMA codes may be the same in different states — they must be combined with state codes for unique identification at the national level.
The three-digit geographic summary level code for a PUMA is 795.
PUMA codes for every vintage are included in the MCDC's MABLE databases, which means they can be used within the Geocorr web applications.
Comparing PUMAs of Different Vintages
MCDC's data collection contains several crosswalks for correlating PUMAs of different vintages in the corrlst ("correlation lists") data directory.
- 2000 to 2010 PUMA equivalency file (CSV)
- 2000 to 2010 PUMA equivalency file (Dexter link)
- 2000 to 2010 PUMA equivalency (Missouri subset)
- 2010 to 2020 PUMA equivalency file (CSV)
- 2010 to 2020 PUMA equivalency file (Dexter link)
We used the 2010 (or 2020, respectively) population as the weight variable, so these files show the overlaps as of April 1 of the respective census year. The variable afact indicates the portion of the earlier PUMA's population living in the later PUMA; the variable afact2 goes the other way, showing what portion of the later PUMA's pop also resides (resided) in the earlier PUMA.
PUMA Master Datasets
MCDC's data collection includes puma_master_2020 and puma_master_2010 datasets. Each observation (record/row) in the dataset describes a single PUMA, providing location information by showing intersections with other more familiar geographies. The dataset also contains a set of key indicator variables from 2013 vintage ACS summary data. We will add a puma_master_2020 dataset once the complete 2020 census data is released (2023).
Using Geocorr to Relate PUMAs to Other Geographic Codes
The Geocorr web applications create reports and/or comma-delimited files showing how different geographic layers correspond to one another. A good example relevant to PUMAs uses Geocorr to show how PUMAs relate to counties in the state of Colorado. To do this, invoke the application and fill out the form as follows:
- Choose Colorado as the state to process.
- From the Select one or more source geographies: list, choose Public use microdata area (PUMA).
- From the Select one or more target geographies: list, choose County.
- In the Output Options section, check the box to Generate a report, and also check the box labeled Generate second allocation factor AFACT2 showing portion of target geocodes in source geocodes. This means that our report will not only show us what portion of the PUMA population resided in the county in 2020, but also what portion of the county population resided within the PUMA.
- Ignore the rest of the options. Click any Run request button to invoke the Geocorr program.
In your browser a page will be generated summarizing the results and providing hyperlinks to the two output Files. If you click on the listing (report format) link you should see a report, the first few lines of which should look like this:
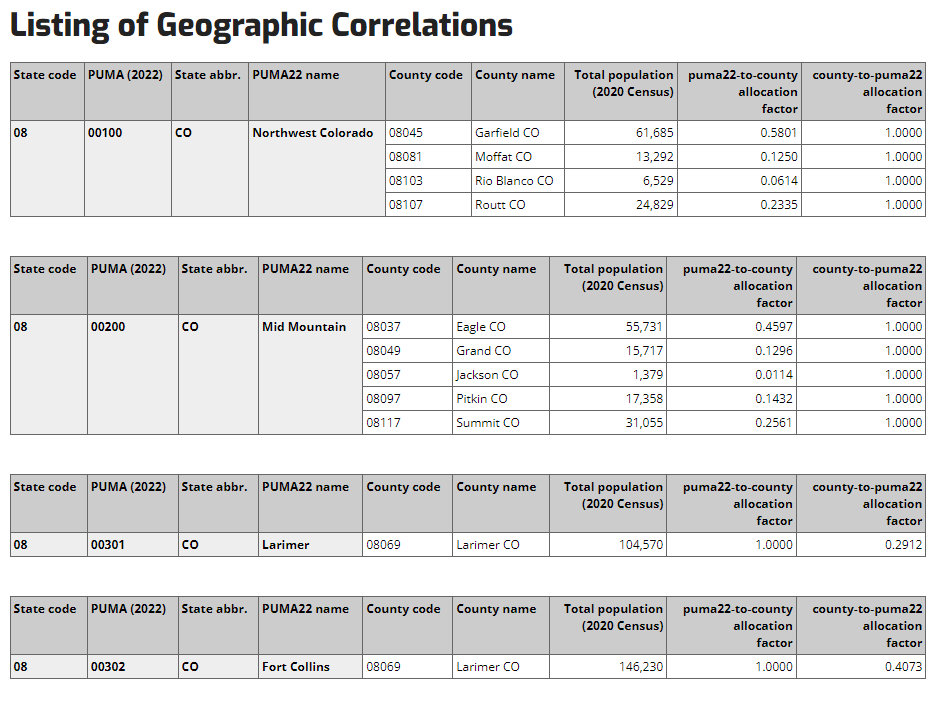
This screen shot shows the first four values of the source geocode, which is called puma22 in Geocorr. Each line of the report represents the intersection of the PUMA area with a target geocode — a county, in this example.
The first line of the report shows that the intersection of PUMA 00100 (Northwest Colorado) with Garfield County had 61,685 persons living in it, according to the 2020 census. The first allocation factor column (puma22-to-county) has a value of 0.5801, which indicates what portion of the PUMA's total population is represented by this intersection. So, 58% of this PUMA's population is in Garfield County. The last column, county-to-puma22 allocation factor, is the allocation factor going the other way. The value of 1.000 tells us that the entire county of Garfield is contained in PUMA 00100.
The third block on this report (for Colorado PUMA 00301, Larimer) shows a result where a PUMA is smaller than a single county. The puma22-to-county allocation factor is 1.0000, indicating that this entire PUMA is made of a portion of Larimer County. The county-to-puma22 allocation factor of 0.2912 indicates that about 29% of the population of Larimer County is within PUMA 00301.
Summary Data at the PUMA Level
The Census Bureau did not publish any summary data for PUMAs based on the 2010 decennial census. You will not be able to find a PUMA summary level on SF1 or using the data.census.gov website. However, it would be possible to aggregate data at the census tract level to create such summaries. You could use Geocorr to generate the required tract-to-PUMA equivalency file.
Data from the American Community Survey are available at the PUMA level. Data published for vintage years 2011 and earlier use the old 2000 PUMAs as the units. Starting with vintage 2012, ACS data used the 2010/2012 PUMAs. Similarly, data for the 2020 PUMAs will be reported beginning with the 2022 ACS release. MCDC's ACS Profiles application includes PUMA-level ACS data.
PUMA-level ACS data can also be extracted using Uexplore/Dexter from our various acs2006 through acs2021 data directories. The usmcdcprofiles and usmcdcprofiles5yr data sets contain summaries at the PUMA level; just filter using SumLev = 795.
Detailed tables in the base_tables_1yr and base_tables_5yr subdirectories (within each acs[yyyy] directory) also contain data at the PUMA level.
More information
- Census Bureau Public Use Microdata Areas (PUMAs) reference page, including maps, PUMA name lists, and equivalency files for 2010 and 2020
- Census Bureau Public Use Microdata Sample (PUMS) reference and documentation
- IPUMS interactive map showing the 2000 and 2010 PUMA boundaries overlaid