All About Measures of Income in the Census
Overview
With the exception of basic population counts probably the most interesting topics for census data users are income and poverty. Folks want to know how many people live in a place and they want to know something about how well those people are living. Income is generally used as a measure of the economic well being of individuals and communities. A common request that we get at the data center is from users wanting to know "where can I get income data for my city [or county or ZIP code or neighborhood]?". Our response to such a request is an enumeration with explanations of some of the many ways of looking at income-based data from the census. A common user response to such a long and perhaps somewhat confusing list of alternatives is to ask us which of these measures do we think is the best, or which do most people tend to use. Our purpose here is to address these questions by presenting descriptions and evaluations of the most commonly used measures of income and poverty in the census. Our special emphasis will be on if, when and why you should consider using each.
What Is Income?
We all kind of know what income is but there is always the fine print. What the Census Bureau counts as income is not exactly the same as what the Bureau of Economic Analysis (BEA) counts. Without going into the detailed differences we can say that BEA counts more things than the Census does. The Census asks about your specific income sources. For the last two decennial censuses and the American Community Survey (which is replacing the decennial census as the instrument for collecting income data in the U.S.) these sources are:
- Wages, salary, commissions, bonuses, or tips from all jobs
- Self-employment income from own non-farm businesses or farm businesses, including proprietorships and partnership (Net income after business expenses).
- Interest, dividends, net rental income, royalty income, or income from estates and trusts
- Social Security or Railroad Retirement
- Supplemental Security Income (SSI)
- Any public assistance or welfare payments from the state or local welfare office
- Retirement, survivor, or disability pensions. Do NOT include Social Security.
- Any other sources of income received regularly, such as Veterans (VA) payments, unemployment compensation, child support, or alimony. Do NOT include lump-sum payments such as money from an inheritance or sale of a home.
The above items are taken verbatim from the long-form questionnaire used for the 2000 census. Note that two of the items in the list allow entering negative values indicating a net loss. An individual's total income is simply the sum of the numbers entered for these 8 categories. Persons under 15 years of age are instructed not to fill out the income portions of the census form; so some paper route money may fall through the cracks.
Census returns coming from the same residential address or household (excluding group quarters addresses) are grouped together for processing. The total of the income figures reported for all individuals at the same address is called the household income. Persons in households who are related by blood, marriage or adoption constitute family households, and the sum of their incomes is referred to as family income. Most commonly used income measures deal with values at the household or family level rather than for individuals. This reflects the role of the household/family as a fundamental economic unit. It is widely recognized that 3 persons living as a family with an income of $30,000 are considerably better off economically than 3 persons living alone each with $10,000 incomes. It may be the same number of dollars per person, but the family benefits from sharing many of the household costs such as mortgage payments or rent, utilities and even food.
Keep in mind that income for persons living in group quarters — places such as prisons, dormitories, nursing homes, or military barracks — are not considered when talking about measures related to household and family income.
Measurements for Persons vs. Geographic Areas
There is a subtle but important difference betweeen the way we measure income for individuals versus how we measure it for the aggregate of persons who live in a geographic area. It is much simpler for an idividual. We we can say about a person, for example, that they have a personal income of $25,000 and live in a family household with four persons and a family income of $65,000. But what about the communities — the state, county, city, ZIP code, etc. that the person lives in — how do we measure the income of such geographic areas? There are many ways to look at the aggregate numbers, starting with the standard statistical measures of a population such as means, medians and percentiles. We can also look at distributions of values, such as a table of households categorized by the value of their household income, or of families categorized by their family incomes. We can also look at per-capita summaries, i.e. summaries on a per-person basis. As a practical matter when working with census data you don't usually have access to data regarding an individual person, family or household — you are looking at data summarized for a geographic area.
To get an idea of what we are talking about, we can look at some actual census data related to income. Figure 1 is the result of running one of the Missouri Census Data Center's standard profile generators to display 3 mini-tables of income-related data for a county in Missouri.
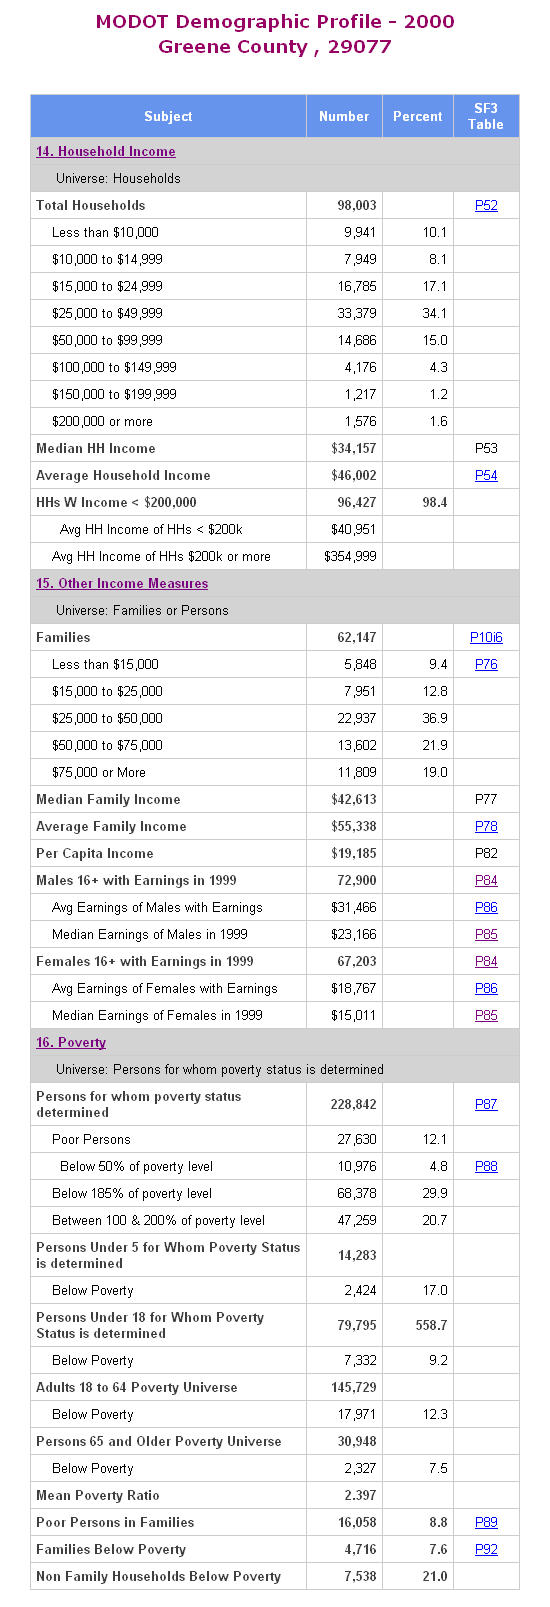
Fig. 1: Typical Income-related Tables from 2000 Census
Table 14 (Fig. 1) begins with an example of a distribution table. Such tables are not very concise measures, but they are simple, convey quite a lot of information, and are widely used. Users can easily do cumulative sums on such tables to arrive at facts such as "about 35% of the households in this county have incomes below $25,000". The last 5 lines of Table 14 contain summary statistics related to household income. Median HH Income is perhaps the single most widely used measure of income in the census. The median of a distribution is the one that ranks in the middle; since there are 98,003 households in this county we can imply from the median that if you ranked all the households in this county by their income the one in the middle (ranking 49002) would have an income of $34,157.
The Average Household Income is another summary statistic based on household incomes; it is the arithmetic mean of these incomes — sum all the household incomes in the county and divide by the number of them (98,003). One reason medians are often viewed as a better central measures than means is that the latter can be distorted by a small number of extremely large values. For example, an area of dire rural poverty that contained the residence of a millionaire could have a respectable average income that would not reflect the "typical" income of the area. Medians, on the other hand, do not take into account values at the upper and lower end of the distibution, but just focus on the middle value.
Returning to Table 14 in our sample tables, we come to a line that contains a count of households with incomes less than $200,000 followed by an average HH income of just these households. This is an attempt to mitigate the distortion of the average that could be caused by a small number of very high income households. The final line of the table provides an average income for just these high income ("$200k or more") households.
Table 15 ("Other Income Measures") is perhaps the most relevant to our discussion, as it displays a number of different income measures. It begins with a mini distribution table of family income levels telling us, among other things, that just over 22% (9.4 + 12.8) of family households have incomes below $25,000. This reflects the typical situation: family incomes are higher than household incomes. This is because family households tend to have more people in them and are also less likely to have very young or elderly householders, whose incomes tend to be less than persons in their prime earning years. The family income distribution is followed by a Median Family Income and an Average Family Income. These measures are similar to their household counterparts, discussed above. The difference, of course, is that they are based on only family household incomes. Median Family Income may be the second most widely used measure of income for an area. So which is the better measure — median household or median family income? It depends on what you plan to do with the information, and on the mix of family vs. non-family households in the area. The problem with using family income measures is that they totally ignore persons living in non-family households, who tend to be disproportionately young or old. On the other hand, sometimes you may want to exclude these non-family cases. If you are looking for a measure that will make your community look like it is better off, then citing family incomes has the advantage of almost always being a higher number. A problem with using household income is that it usually involves some mixing of apples and oranges; it includes 1-person households as well as 4 and 5-person family households and treats all their incomes as somehow equivalent. A $20,000 household income for a person living alone is nowhere near the same as a $20,000 income for a family of 4. But in combining them for the sake of getting a statistical measure such as a mean or median we are treating them as equals.
One good practical reason for using family income measures instead of household is that there are many government guidelines and statutes that require communities to use family income as the basis for eitehr qualifying and/or for being categorized within a government program. Why this is so, I am not sure. There could be some programs that are aimed specifically at family households, but that is not typically the case.
Per-capita income (PCI) is the first measure we come to that is person-based. It is simply the total aggregate income for the area divided by the total population. Occasionally you will see a variation on PCI where institutionalized persons are omitted from the denominator when calculating the statistic. Most researchers familiar with these concepts do not view PCI as their measure of choice, since it does not take into account the economies of scale involved when people share a household. Advantages of PCI include it being easy to calculate and readily available. A good example of why it may not be the best measure of economic well being is the case of Utah, which has by far the largest average household size of any state. Based on 2003 income Utah ranked 15th among the states in median household income, but 46th in per-capita income. If you are trying to measure economic well being with these figures most people would say that Utah is nowhere near being one of the poorest states; perhaps the 15 ranking is a bit high, but the 46 ranking is way too low (using the inverted scale of rankings where 46th is lower than 15th).
The remaing lines of Table 15 deal only with income categorized as earnings, and are means and medians of gender-based subpopulations. These figures are more about relative compensation levels for men vs. women than they are about measuring overall economic wellbeing. A flaw in these figures is that all people with earnings are counted equally; people who only worked part time or only part of the year are counted the same as those who worked full time, all year round.
Poverty
Table 16 is about poverty, a topic that we have not yet discussed but which is obviously very closely related to our subject, income. Definitions play a key role when dealing with poverty. The definition of income is relatively straightforward, with basic definitions and methods widely agreed upon. But attempts to define precisely what constitutes poverty (and thus measuring it) are another matter. Poverty is a very politicized subject. Presidential administrations are measured by their ability to reduce the poverty rate, and may be condemned if it goes up during their tenure. Most economists think the definitions currently in use are badly in need of updating. The basic ways in which poverty thresholds are determined have undergone only relatively minor changes (in 1969 and 1980) since they were originally established by the Social Security Administration in 1964. Changing the way the thresholds are defined would, of course, change the number of people who are considered poor. Many of the recent proposals for changing the thresholds would have resulted in an increase in the number of people classified as poor, and hence an increase in the poverty rate. When these rates go up, the opposing party can be counted on to point out the fact and to blame the party in power for presiding over a decline in the well being of the country.
The concept of poverty as used by the Census Bureau (and all other federal agencies) is tied to the concept of a poverty threshold — a specific dollar amount that represents the dividing line between non-poor and poor. If your income is below the poverty threshold then you are classified as poor, and if your income meets or exceeds the figure you are not. There is no single poverty threshold that is used for all persons, but rather annually revised sets of poverty threshold tables. An example of such a table is shown in Figure 2 (with a little truncation of columns to the right to make it fit).
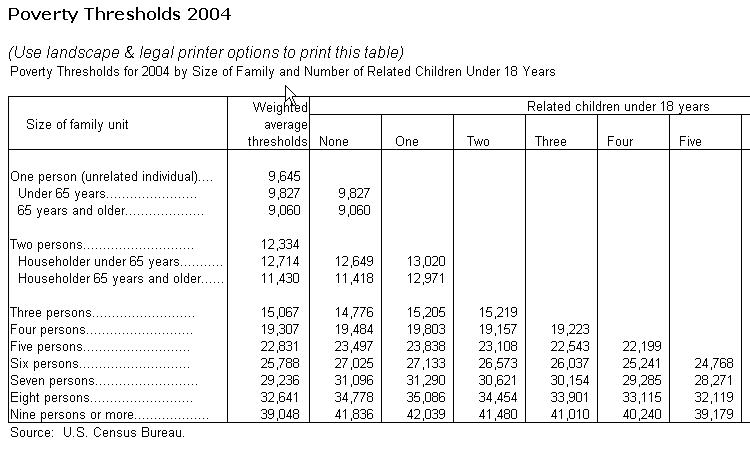
Fig. 2: Sample Poverty Threshold Table
The basic idea is that most persons fall into exactly one of the cells of one of these tables. To see what your poverty threshold is (or was, in 2004) look for the line that describes your "family unit" by size, and possibly by the age of the householder. If you are not in a family household, then use the first row — you are an unrelated individual. This also applies to persons who live in a household that has a family living there but are not part of the family. Once you have the row determined, look in the column based on the number of related children under 18. Thus, if you were part of a family of four people with two children under 18, your poverty threshold in 2004 was $19,157. This number applies to all 4 persons in the unit. How these thresholds are determined is beyond the scope of this paper, but the obvious idea is that the larger the household the more income is needed, and the more children present the more money is required — adding an adult to a household does not raise the threshold as much as adding a child. The special case of a one or two-person household headed by someone over age 65 sets the threshold slightly lower for the elderly household.
What if you lived in a dormitory or were in prison in 2004? The poverty threshold table really does not have a row or column that applies to you. You are one of those persons who falls outside the poverty universe. Table 16 in Fig. 1 includes the line "Universe: Persons for whom poverty status is determined". This means that the concept of poverty is only applied to a subset of the population. To quote the Census Bureau online documentation:
Poverty status was determined for all people except institutionalized people, people in military group quarters, people in college dormitories, and unrelated individuals under 15 years old. These groups also were excluded from the numerator and denominator when calculating poverty rates. They are considered neither "poor" nor "nonpoor."
Mean Poverty Ratios
Poverty thresholds provide not only a way of letting us say whether or not a person is poor, they also give us a tool for quantifying degrees of poverty. If you are in that family of 4 where the threshold is $19,157 and your family's income is $19,000 then you are poor, but just barely; if, however, your family's income is only $7000 then you are obviously significantly worse off. (There is no formal definition of "dirt poor" used in the Census, but if there were, the 4-person family with $7000 in income would probably be in that category.) This degree of poorness can be expressed as the ratio of your family income to the threshold figure: $19,000 yields a poverty ratio of .99, while the $7,000 figure results in a ratio of only .365 . A family of 4 with 2 kids and a family income of $38,314 has a poverty ratio of 2.0 . That same family with $76,628 of income would have a poverty ratio of 4.0. Clearly this number, which is used by the Census Bureau almost entirely for the purpose of describing and analyzing lower-income persons and families, is actually a measure of wealth as well (using "wealth" in the sense of having a large income rather than as in "accumulated wealth").
Some of our census data users' very favorite tables on the census summary files are those that have ratio of income to poverty level as one of the dimensions; see, for example, Table P88 for Greene County from the 2000 census, summary file 3. The only thing wrong with this table (and this sadly applies to every table we have ever seen that uses a poverty ratio distribution) is that the last (highest) interval is 2.00 and over, a category that includes about 70% of the county's poverty universe population (not atypical — the figure for the entire U.S. is 70.4%). Why not go ahead and show intervals at the higher end of the scale as well as the lower? People are interested not only in poverty but with the other end of the economic spectrum as well. To quickly summarize the point: Poverty ratios are also measures of wealth.
Returning to Table 16 in Fig. 1, we see a series of lines that report on a specific poverty universe followed by lines that indicate the poverty levels of persons in that universe. The poverty universes start with (all) persons for whom poverty status (is) determined and then a series of age-based subsets of this group (under 5, Under 18, 18-64 and 65+). The 12.1 percent figure in the 2nd row (poor persons) is called the poverty rate and is one of the most frequently cited statistics for measuring the economic wellbeing of an area. (If you're wondering why we bothered to report persons belows 185% of the poverty level, it's because there are several federal programs that use 185% of poverty as a cutoff point for eligibility.)
One of the more interesting items in any of our income-related tables appears after the line with poor persons over 65. It is called the mean poverty ratio. This is a statistic that we at the Missouri Census Data Center have invented. It is our attempt at encapsulating the poverty ratio data in a single number for the geographic area. We have to go with what data the Census Bureau provides to us on their summary file (in this example, 2000 census, summary file 3), which means we have the data in Table P88 (see link, above) which tells us the number of persons in each of 9 poverty ratio intervals. The first interval is "Under .50", the second is ".50 to .74" (to be perfectly precise it is from .5 to less than but not including .75), etc. The formula for the Mean Poverty Ratio (MPR) involves using the midpoint of each interval and pretending/assuming that the average ratio of persons in this interval falls at the midpoint. So when we have 10,976 people below 50% of the poverty level we treat this as if we had that many people at precisely 25% (.25 being the midpoint of the interval) of the poverty level. For the next interval we use .625 as the midpoint of the interval, etc. For the 9th and final interval (2.0 and above) we use the rather arbitrary value of 3.0; there is, of course, no real midpoint for this open-ended interval. We take the sum of our midpoints-multiplied-by-cell-count products and divide by the N of the table to come up with an estimate of the mean poverty ratio in the area. We feel comfortable with this number for areas where a substantial portion of the population is outside the final 2.0-and-above interval. Of course, there are a lot of geographic areas where this is not the case.
A Few Last Measures of Poverty
Our Table 16 concludes with 3 more poverty measures. Poor Persons in Families gives us a count and a poverty rate that just looks at persons who live in family households. The following line, Families Below Poverty is a similar measure but the unit being classified is the household, not the persons within the households. Note that 8.8% of the people who live in families are classified as poor while only 7.6% of families are poor. What this says is that families that are poor have (on average) a few more people in them than non-poor families (at least in this county). Which makes sense; how many married couples without any kids are poor?
The final line of Table 16 tells us how many and what percent (21.0) of non-family households are classified as poor. Note the relatively high rate of poverty as compared to family households 21% vs 7.6 — almost 3 times the rate. The corresponding percentages for the entire state are 18.4 and 8.6 (poverty rates for non-family and family households, respectively). In Boone county (home of the state university) the numbers are 26.4 and 7.6. Why would a county like Boone that is generally well-off economically by most key indicators have one of the state's highest poverty rates for non-family households? And why did we mention that Boone was the home of the state university?
We mentioned earlier that many people think the criteria used to define poverty are badly in need of updating. The strange poverty figures for Boone county (and, to a lesser extent, Greene county, home of Missouri State University) reflect one of the more obvious loopholes in the definition. If you go back to the start of our discussion, where we enumerated the 9 categories of income gathered by the census, you will note that money you receive as a gift or as an allowance is not one of them. As long as you are living in a household that has a higher level of income, you are assumed to have your share of that income, and your poverty level is determined accordingly, even if you personally are a high school student working at McDonald's on weekends for poverty-level wages. Once you move out of the house — such as when you go away to college — then you are no longer considered part of the household. So, you temporarily move to Boone County to attend college, and your parents set you up in a nice apartment and send you spending money each month to help support your beer and pizza habits. They may send you enough that you don't have to work at all, but if you do work, chances are good that it will not be a very high-paying job. The result is that many college students living away from home — and outside a dormitory — wind up being classified as poor.
If you live in a dormitory you become one of the persons for whom poverty status is not determined. Ironically, if you or your family are well-off enough to afford to live off campus, then you are much more likely to be considered poor. The moral of this story is that poverty rates for areas that have large college student populations (excluding dormitory residents) are grossly overstated. The easy fix for this problem is for someone to just change the definition so that any person enrolled in college is excluded from the poverty universe, whether they live in a dormitory or not. But doing that would change the poverty rate for a lot of cities and counties, and an awful lot of federal money gets distributed based on those rates. So it becomes much more than just a matter of getting the measure right.
A Summary of Key Income Measures
The following table lists some of the statistics we have discussed in this paper, indicating their strengths and weaknesses. We have rated each measure on a scale of of 1 to 4 stars based on its relevance as an indicator of economic wellbeing.
Table 1: Summary of Key Income Measures
| Measure | Brief definition | Pros | Cons | Notes | Rating |
|---|---|---|---|---|---|
| Median household income | If you sorted all the household incomes, the median is the value of the one in the middle. | Takes into account all households in an area and is a pretty good measure of a typical income level for the area. | The measure weighs all households the same — persons living alone have the same weight as 5-person families. As a median the measure does not take into account incomes at the extreme ends of the distribution. | This is perhaps the most widely used and accepted measure of income. | *** |
| Median family income | If you sorted all the family household incomes from lowest to highest, the median is the value of the one in the middle. | Sometimes you want to exclude those non-family households from the measure. Avoids the apples-and-oranges mixing of family and non-family HHs. Commonly used as a required measure for governmental programs. | Excludes non-family households, so it does not take into account everybody in the community. Could be very misleading in a community with a significant non-family-household population. As a median the measure does not take into account incomes at the upper and lower ends of the distribution. | A widely used and accepted measure of income. | ** |
| Mean (average) household income | Add up all the household incomes and divide by the number of households. | Takes into account all households in an area and is the average income level for the area. Averages are venerable,widely-used statistical measures. | The measure weighs all households the same — persons living alone have the same weight as 5-person families. Averages can be distorted by a small number of extreme values, especially at the high end. | Not as widely used and accepted as median household income, but still a useful measure. | ** |
| Mean (average) family income | Add up all the family incomes and divide by the number of families. | Sometimes you want to exclude those non-family households from the measure. Avoids the apples-and-oranges mixing of family and non-family HHs. Averages are venerable, widely-used statistical measures. | Excludes households, so it does not take into account everybody in the community. Could be very misleading in a community with a significant non-family-household population. Averages can be distorted by a small number of extreme values, especially at the high end. | Not as widely used and accepted as median family incomes, but still a useful measure. | ** |
| Per-capita income | Total income reported in the census divided by the total population. | Outside the census, agencies like the BEA are able to estimate total income without doing a detailed survey and thus can publish PCI estimates. For some reason a lot of people think this measure is somehow more "fair" because it counts everybody and is just so simple. | It ignores the fact that certain people who are counted in the denonminator do not have their income included in the numerator (people in institutions, military barracks, etc.) and also makes no allowance for how the people are distributed in households. It counts 3 people each living alone with an income of $6,000 the same as a 3-person family with an income of $18,000 (even though the first case involves 3 people classified as poor while the latter has none). | People still ask for it and use it, apparently. | * |
| Poverty rate | Total persons whose income is below the poverty threshold divided by the total number of persons for whom a poverty threshold is defined. | Poverty thresholds take into account the composition of the household, recognizing that the same amount of income can purchase different amounts of economic well being depending on whether it is shared within households. The percent of persons who fall below the line is a reasonable way to summarize the poverty situation for an area. | Not a good general measure of economic well being because it focuses entirely on the low end of the scale. Poverty rates are pretty much irrelevant in upscale neighborhoods and towns. Even as a measure of economic distress it is somewhat arbitrary in that it lumps everybody into poor/not poor categories without considering how far below or above the poverty threshold they may be. The guidelines for setting the thresholds are out of date. They do not, for example, take into account the differences in cost of living in different areas. Off-campus college students from well-off families often get classified as poor, distorting the figure in college towns. | This is the number that makes the headlines. Very politically sensitive. | ** |
| Mean poverty ratio | Ideally, this would be the sum of the poverty ratios of all persons in the poverty universe divided by the number of persons in that universe. But because of the way the data get reported, it has to be estimated from poverty ratio distribution tables that provide no detail above a ratio value of 2. (This limitation no longer applies starting with ACS data for 2005). | The poverty ratio is probably the single best measure of a person's economic wellbeing. It not only takes into account their income (including the income of the person's entire household) but also the structure of the person's household, as built into the poverty threshold tables. If this is so, then taking the average of these numbers should be the best measure of a community as well. It has the additional benefit of being timeless: a mean poverty ratio for a community looked at over a 40-year period would not require any adjustment for inflation: that would already have been factored into the poverty thresholds upon which the poverty ratios are based. (Except for poverty rate, all the other measures in this table have the implicit "minus" of having to be adjusted for inflation when doing almost any time-series analysis.) | There is a serious downside, based primarily on the lack of data regarding poverty ratios over 2 in the summary census products. Because of this, MPRs are like poverty rates in well-off areas — not very relevant. They could and should be, but we need to have access to more detailed summary tables to change this. These ratios are available all the way up to values of 5 — where they are "capped" — on the PUMS microdata sample files. The other downside is having to explain how you calculated it. Does not have the official endorsement of the Census Bureau or any other federal agency, yet. The problem of no summary data for ratio values > 2 goes away in the 2005 American Community Survey data, where table B17002 now provides summary data with poverty ratios in the key intervals 2-3, 3-4 and 4-5. We have used this table to generate a dataset with MPR values for all geographic areas for which we have 2005 ACS data. | In a rational world, this would be the fairest and most widely used measure of economic wellbeing. | *** |