Ten More Things to Know About the American Community Survey
Revised June 7, 2021
- Manuals
- Geography
- Data Profiles, MCDC
- Data Profiles, Census
- Trend Data
- Detailed Data via AFF
- Compatibility Issues
- Custom Extracts from MCDC
- ACS PUMS
- Control Totals/Census
Introduction
A few years ago, we created Ten Things to Know about the American Community Survey, which became one of our most popular pages. Its purpose was to provide a general overview for people just getting started with this new and important data resource. But some things have changed in the years since it was written. The ACS has gotten more complicated, and many more people have started using it. The Census Bureau has enhanced the way the data can be accessed via their data.census.gov site, and they have also been creating all kinds of metadata and tutorial material to help users.
MCDC has created a number of resources to assist users in finding and accessing the ACS data, including our own set of data profiles and datasets accessible via the Uexplore/Dexter software tools. Several of the items covered below will reference these resources.
1. Read the official documentation.
The Census Bureau has created an extensive collection of guidance for ACS data users. These pages provide user-friendly information about the ACS. There are several useful ACS handbooks targeting specific groups, including first-time ACS data users, general data users, the business community, and state and local governments. These PDF handbooks run about 65 pages and vary widely in general relevance and degree of difficulty.
2. Get a handle on the geography.
Most ACS data products consist of data aggregated to various geographic areas: states, counties, cities, census tracts, school districts, etc. You really cannot use the products effectively unless you have a good basic understanding of the geographic dimension of the data. The Census Bureau provides an overview of geographic areas page that is must-read material for any ACS user.
3. Access ACS data as profiles on the MCDC website.
A profile, in census terminology, is a report that focuses on a single geographic area and provides carefully chosen key indicator data that gives a quick overview of that area. Profiles typically have a subject area associated with them; we have economic profiles, demographic profiles, social profiles, etc.
If you are almost anywhere on the Missouri Census Data Center (MCDC) web site, you can use the main menu, Data submenu, to access the MCDC's ACS Profiles application. The front end here is fairly simple: Choose a time period, an area type, and a state. Based on your choices, you'll see the available geography choices in the list. So, for example, if you choose the 2014-2018 time period, Places (Cities) as the type of area, and Missouri as the state (it's the default), you should see all cities in Missouri that had five-year data for this period. You can now choose any city or cities (up to four) from the choices displayed. The chosen areas appear in the "cart" window on the right. Here is what the menu page looks like after making these choices:
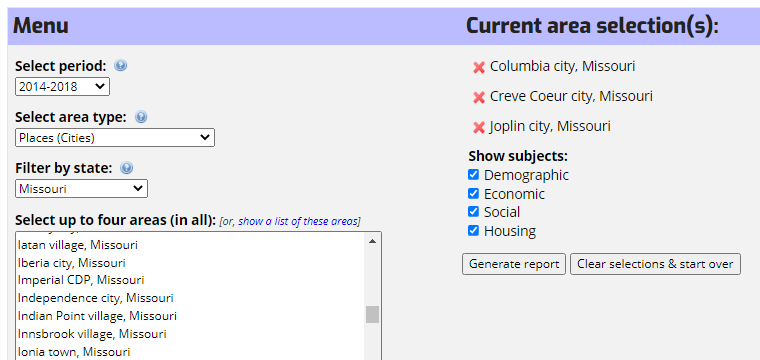
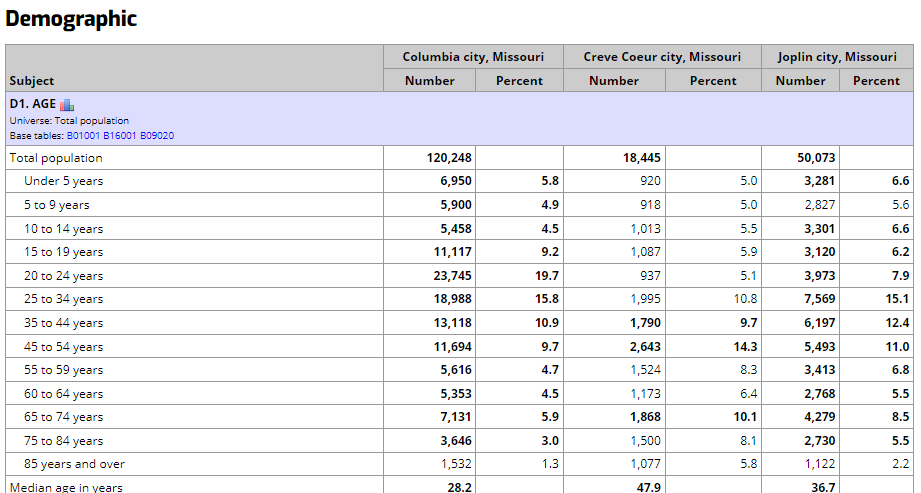
We also have some checkboxes across the bottom corresponding to the four profiles subjects (demographic, economic, social, and housing) that can be used to be selective the topic(s) of interest. At this point click on the Generate report button and you should see something like this:
Use this URL to bypass the menu and display this report as specified. Then you can scroll down and see the entire report, which is rather lengthy. There is actually quite a bit that can be said about these profile reports, and we tried to say most of it in the usage notes link at the bottom of the report.
Here is a close-up view of a portion of the economic profile portion of the report, showing a table of household income distribution for the cities in our report. Columbia is over twice as large as Joplin, so you might expect less sampling errors in the larger city.
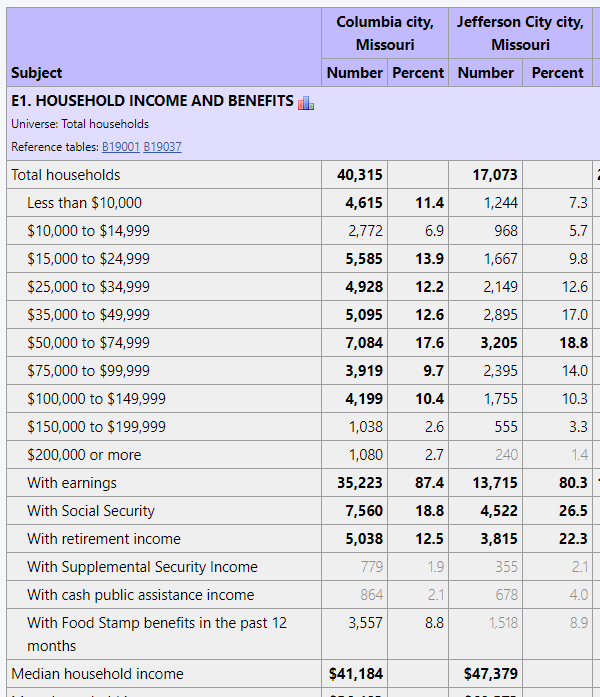
This illustrates the use of fonts to indicate statistical reliability. Focus on the column of numbers for Creve Coeur. Of the ten income interval counts, only the $200,000 or more interval is displayed using a bold font, while the entry for the $15,000 to $24,999 interval is shown in a very light font. This is quick visual warning that the 363 estimate of households with the $15,000 to $24,999 income level is not very statistically reliable. If the user places the mouse pointer over the 363 value in the report, the report will display +/- 39.12% (221, 505), which reports the relative margin of error (i.e., the MOE as a percent of the estimate) followed by the confidence interval. There is a 90% chance that the true count is somewhere between 126 and 234, which is a rather large grain of salt. Details of how this works are provided on the usage notes page.
4. Access ACS data as profiles on Census Bureau website.
Access the Bureau's data profiles by starting at data.census.gov and choosing data profiles as the survey type. Data profile table names begin with "DP". Keep in mind that if you choose the one-year period instead of the five-year period, you will have many fewer geographic areas to choose from. On the other hand, the five-year data are not as timely. These profiles are well formatted and contain extensive and sometimes helpful footnotes.
Data.census.gov also includes some easy-to-use basic profiles. Start at the United States level and then use the list at the bottom of the page to choose your state of interest.
5. Trend reports/comparison tables.
Many users would like to see data from the most recent decennial census compared to the latest data from the ACS. But that isn't available, and perhaps never will be. There are many issues regarding comparability of data collected from these two surveys (see item 7). So that leaves us with trends within the ACS data based upon different time periods.
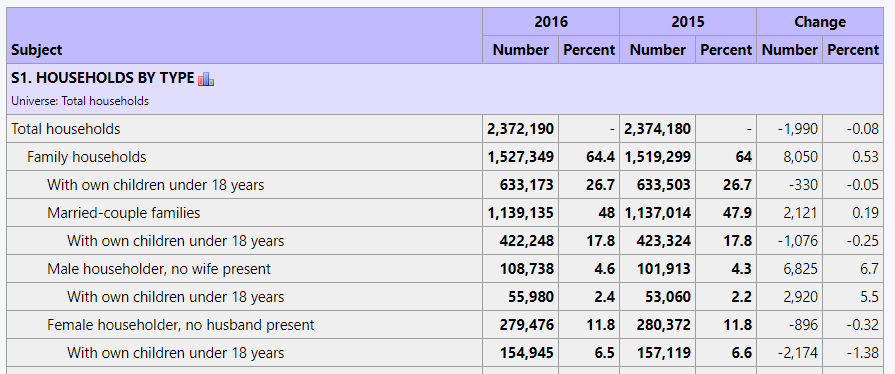
There is a general rule of thumb that prohibits comparing multiyear period figures where the two periods overlap (at least for the sake of detecting any trend). For now, you can access the Census Bureau's comparison profile products or the MCDC's ACS Trends application. This application is a companion to the MCDC's ACS Profiles application (see above). It only allows you to select a single geography. Here is a snapshot of a portion of an ACS Trends report for the state of Missouri, comparing 2016 to 2015:
6. Accessing detailed characteristics via data.census.gov.
We have thus far focused on getting access to the commonly accessed profile data in the ACS. However, there is much more ACS data, including very detailed and multidimensional tables. These are the ACS detailed tables (aka base tables). The easily overlooked resource that we want to lift up here is the Census Bureau's data.census.gov detailed tables and table search tools.
We'll illustrate with an example. A user calls with a question: They would like to know if they can get data on the poverty ratios of senior citizens within the state. Ideally, they would like to know how many are below 130% of the poverty level. Can you help?
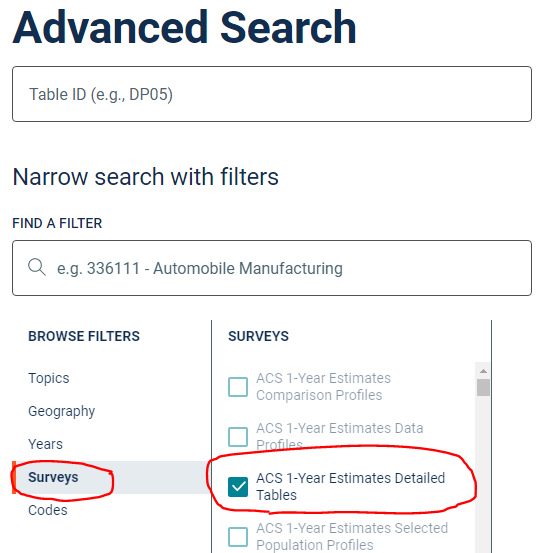
Go to data.census.gov, Advanced Search. Expand Surveys, then choose the appropriate data set. Since it is data at the state level, you would probably want the latest single year estimates.
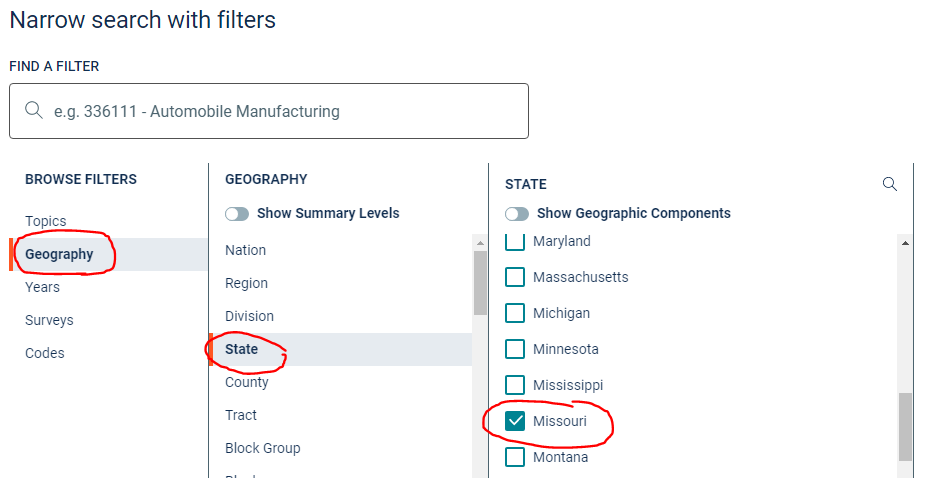
Proceed to the Geographies selector and add Missouri:
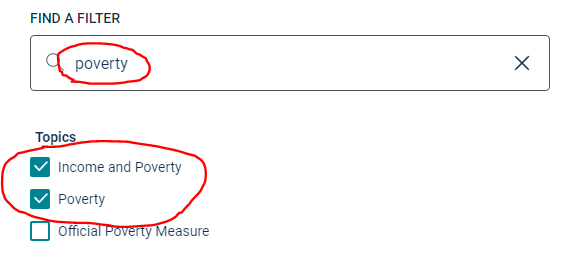
Can you answer the question regarding the availability of the detailed poverty ratio data for the elderly population of your state? Enter "poverty" into the Filter box and click Go:
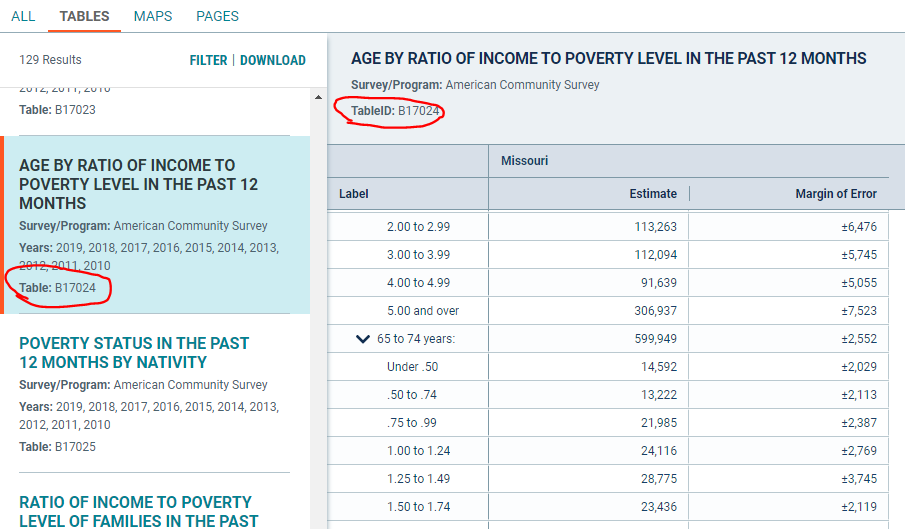
So what happened here is that we went from over a thousand ACS detailed tables, down to just these few that have been associated with our keywords. We still have to figure out which, if any, of these is going to have information suitable for answering the question at hand. It looks like table B17024 is a good fit:
This is a simple example. Often the questions are considerably trickier and require some knowledge of the data to navigate through the maze of available tables.
7. Understanding data comparability issues.
Data comparability is something that you must consider with the ACS before you use it to say anything about trends. The Bureau has issued guidance for comparing ACS data.
8. Downloading custom extracts from the MCDC website.
This item is for users that need more control over data filtering and/or the format of that data.
For example, suppose you want to get a certain set of key variables for every state in the country or for every PUMA in your state for the most recent two ACS survey years and put them in Excel spreadsheets for further analysis. The variables you want may be the standard ones found in the data profile reports from the Census Bureau or MCDC web sites, or they might be something more customized requiring access to the base (detailed) tables.
These tools allow you to create such extracts in various formats, including comma-delimited, SAS dataset, and PDF or HTML report files. You get to choose your rows/geographic areas. Finally, you can choose your subject content, or variables. The datasets from which you'll be extracting have good geographic identifiers: FIPS codes, the Census Bureau's Geoid fields, geographic name fields, etc. are all included on the datasets and thus can be easily kept as part of your downloaded extracts.
Because of its length and technical nature of this item, we have moved it to a separate web page.
9. ACS PUMS.
There are two important aspects of this item — the what and the how of PUMS processing. Any serious user of the ACS needs to be aquainted with this capability.
PUMS (public use microdata sample) data are special files released by the Census Bureau containing disclosure-avoidance-enhanced versions of actual ACS survey questionnaires. The other data we have been talking about (profiles and base tables) are all pre-tabulated summaries of geographic areas. The PUMS is microdata, rather than summary data. It is raw data that allows you to create your own custom data tabulations and analyses. It allows you to consider answering questions such as these:
- How many families in Missouri with children under 18 are below 130% of the poverty level?
- What is the mean poverty ratio of all persons living in mobile homes in Missouri portion of the Kansas City metro area?
- How many and what percentage of persons over 65 in the state of Illinois share a household with another person over 65 of the opposite sex?
So what do each of these data questions have in common that make them amenable to a PUMS-based solution?
- They do not require great geographic detail. The only one of the three that needed something finer than an entire state was the one that involved the KC metro area. (The smallest geographic entity that is identified on a PUMS record is the PUMA, which is an area specifically designed to be the geography of the PUMS file, and which are required to have a population of at least 100,000.)
- They involve a somewhat unusual data categorization. Oftentimes, it is the crossing of dimensions (e.g., a certain age cohort with one or more other characteristics). The Census Bureau simply cannot anticipate all the possible combinations that users may find helpful.
- Some special household-composition characteristic, such as the elderly sharing a household with another elderly person of the opposite sex.
So how does this work? The Census Bureau has published a special Handbook for ACS PUMS users.
Those wanting to use SAS to access the ACS PUMS datasets and generate custom tabulations might find it useful to browse the MCDC's ACS PUMS data collection via our Uexplore utility. Note that we not only have the datasets, but also the data dictionary files, which are indispensable for processing.
10. Control totals and the decennial census/ACS link.
For most users of survey data, knowing the details of how sample weights are assigned to the data is not necessary. In most cases, data users trust that the data providers have advanced statistical training. We trust that they will be doing what's best to make the data useful and as accurate as possible. But with the ACS, there is so much being done in this area of statistical weight adjustment, and because it involves what some consider to be a somewhat radical make-it-fit approach, that we think it requires that you have some idea of how it works.
A control total is just a number that exists independent of the survey and represents a known quantity. It is typically used to assign or adjust a weight to the sample data, so that when we aggregate our data using our sample weights, we get numbers that match the control figure.
For example, suppose we knew that the total population of Missouri was six million, and that when we processed the ACS survey data and assigned the initial person weights they summed to 5,700,000. Using our control figure, we could go back and adjust the weight assigned to each survey, multiplying it by 6,000,000/5,700,000, or about 5.3% . Now, when we use the adjusted weights to aggregate our data, it comes out with a total population of 6,000,000 to match the figure that we assume to be correct.
In the ACS scheme, there isn't a simple total population or total households control figure; instead, there is an entire array of control totals that involve the basic demographic categories of age, sex, race, and Hispanic origin. These controls are imposed at the county level. The Bureau does official estimates of county populations using these four basic demographic categories. It is this adjustment process that results in the total population of all counties (and entities comprised of counties) to exactly match the most recent official county estimates.
Some users have concerns about the ramifications of this approach:
- These adjustments work at the county level, but what does it do to data at other levels, such as place (city) or census tract? Doesn't it have the potential to distort the data for smaller geographic entities?
- The official estimates used as the control totals are derived from the most recent decennial census figures and are point-in-time July 1 estimates. As such, they reflect census residency rules, which can lead to significant differences between what the population of an area is by ACS definitions vs. the estimates. College towns and areas with large seasonal populations are example of areas where such differences can be the most dramatic.
- The official county estimates are a good best guess at the true population of counties but, unlike decennial census enumerations, they are far from perfect. There is nothing built in to the MOE measures provided with the ACS data that take into account the amount of error that may be present because the underlying control totals are wrong.
So where does the decennial census fit it? Because it is an enumeration (a complete count) rather than a sample survey, it is not subject to the kinds of sampling error that the ACS is. Unlike the official estimates program, these demographic profiles are not limited to the county level; we have them all the way down to the smallest census block.