A recent report by the U.S. Census Bureau provides a comprehensive look at the nation’s 40+ million persons aged 65 and older.
The 192-page report, 65+ in the United States: 2010, contains many findings about the senior population on topics such as socioeconomic characteristics, size and growth, geographic distribution, and longevity and health. The report incorporates research from many recent studies that draw heavily from the 2010 Census and nationally representative surveys, such as the Current Population Survey, American Community Survey, and National Health Interview Survey.
Some highlights of the report:
- Size and growth: In 2010, there were 40.3 million people in the U.S. aged 65 and older — 12 times the number in 1900. Eleven states had more than one million people 65 and older in 2010.
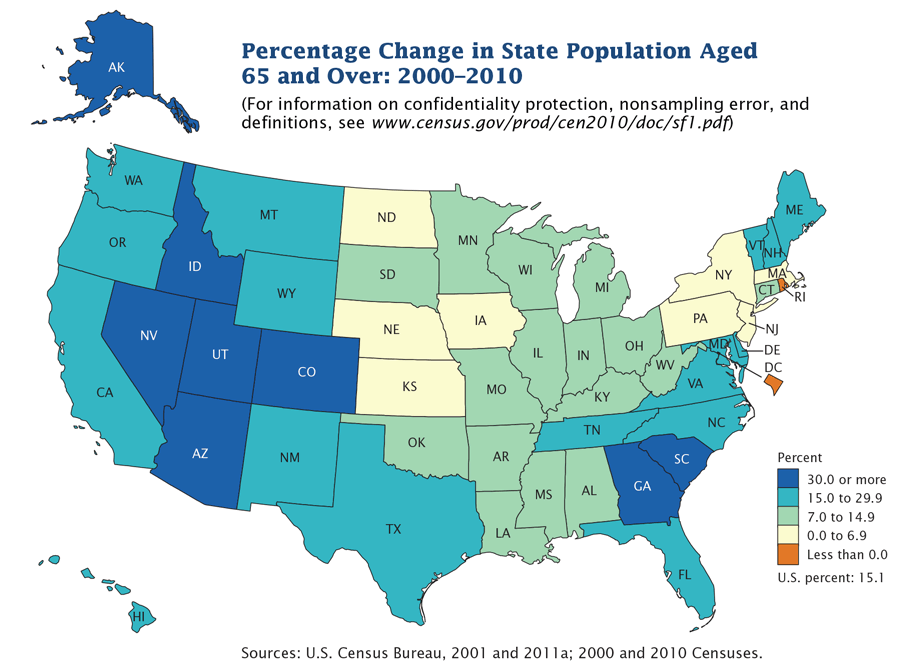
- Geographic distribution: Florida was among the states with the highest proportions of older people in their populations in 2010, along with West Virginia, Maine, and Pennsylvania (all above 15%). The West and South regions experienced the fastest growth in their 65+ and 85+ populations between 2000 and 2010. Sumter county, Florida — home to a large retirement community — had the nation’s highest median age among all U.S. counties in 2013, at 65.5 years.
- Elder care: The number of Americans 65+ living in a nursing home fell 20% between 2000 and 2010, from 1.6 million to 1.3 million. Meanwhile, the share in other care settings has been growing. (Economic statistics from the Census Bureau’s 2012 County Business Patterns also show changes in health care-related industries. For example, the number of employees in long-term care facilities grew by about 12% between 2007 and 2012.)
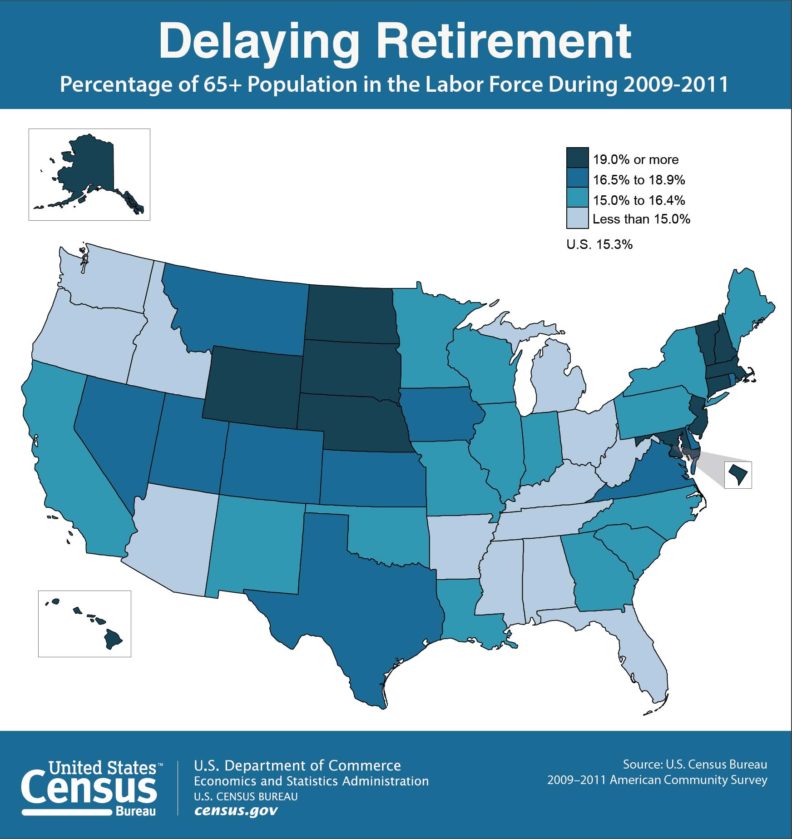
- Labor force participation: Major retirement destinations, such as Arizona and Florida, had lower 65+ labor force participation rates compared with Midwest states, such as Nebraska, North Dakota, and South Dakota, where a higher share of the older population was still part of the workforce. “In the United States, older men and women are increasingly participating in the labor force,” said Enrique Lamas, the Census Bureau’s associate director for demographic programs.
- Home ownership: Following 2006 and the peak in housing prices, home ownership rates remained stable for older householders at 81% in 2011, compared with the under-65 population who experienced declines.
- Employment: Many older workers remained employed during the 2007-2009 recession. 16.2% of the 65+ population were employed in 2010, up from 14.5% in 2005. (By contrast, 60.3% of the 20–24 age group were employed in 2010, down from 68% in 2005.)
- Internet usage: Between 2000 and 2010, Internet usage for the 65+ population increased from 14.3% to 44.8%.
The Division of Behavioral and Social Research at the National Institute on Aging (NIA) commissioned this report and has also supported three earlier editions, the first published in 1993. “This report series uniquely combines Census Bureau and other federal statistics with findings from NIA-supported studies on aging,” said Richard Suzman, director of the Division of Behavioral and Social Research at NIA. “The collaboration with Census has been of great value in developing social, economic and demographic statistics on our aging population with this edition highlighting an approaching crisis in caregiving — since the baby boomers had fewer children compared to their parents.”