A new report from the U.S. Census Bureau’s American Community Survey (ACS) shows that one in four U.S. residents now live in poverty areas — up from fewer than one in five in 2000.
A “poverty area” is defined as any census tract with a poverty rate of 20% or more.
The number of people living in poverty areas increased from 49.5 million (18.0%) in 2000 to 77.4 million (25.7%) in 2008-2012. The overall U.S. poverty rate was 14.9% for the same period.
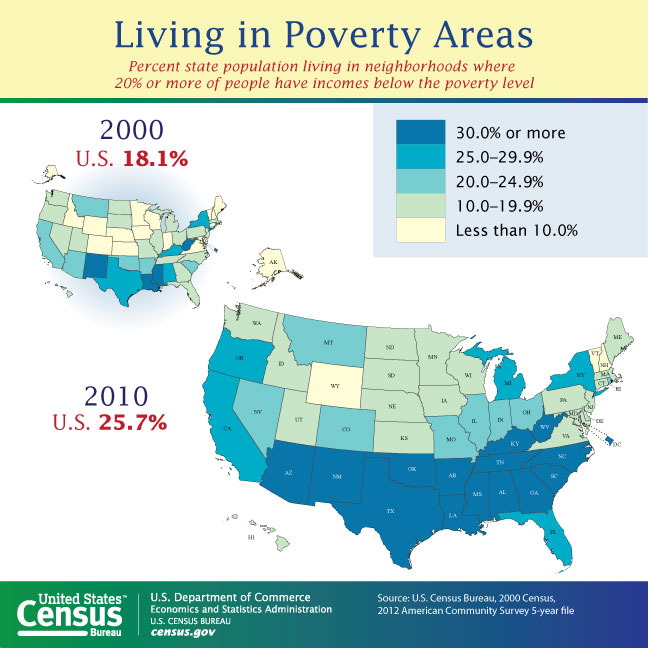
By state, the percentage of people living in a poverty area ranged from 6.8% in New Hampshire to 48.5% in Mississippi. Several states saw declines over the period: District of Columbia (-6.7%), Louisiana (-3.6%), West Virginia (-2.3%), Alaska (-0.4%), Hawaii (-1.0%), and Alaska (-0.4%). On the other hand, North Carolina (17.9%), Oregon (16.0%), Tennessee (16.0%), Arkansas (15.7%), and Georgia (14.6%) had the largest increases in the proportion of people living in poverty areas.
More than half of people living in poverty lived in a poverty area, and about 30% of people living in poverty areas had incomes below the poverty level.
The report, Changes in Areas with Concentrated Poverty: 2000 to 2010, uses data from the 2000 Census and the 2008-2012 ACS five-year estimates to analyze changes in the spatial distribution and socioeconomic characteristics of people living in poverty areas.
According to the report’s author, Alemayehu Bishaw of the Census Bureau’s Poverty Statistics Branch: “Researchers have found that living in poor neighborhoods adds burdens to low-income families, such as poor housing conditions and fewer job opportunities. Many federal and local government agencies use the Census Bureau’s definition of poverty areas to provide much-needed resources to communities with a large concentration of people in poverty.”
Other highlights of the report:
- Missouri’s percentage of people living in poverty areas (24.9%) is just slightly lower than the national rate and represents a change of 9.9% over the period.
- In the 2008-2012 period, in 14 states and D.C., 30% or more of the population lived in poverty areas. In 2000, this was true of four states and D.C.
- Of the people living in poverty areas in the 2008-2012 period, 51.1% lived in central cities of metro areas, 28.6% in suburbs and 20.4% outside metro areas.
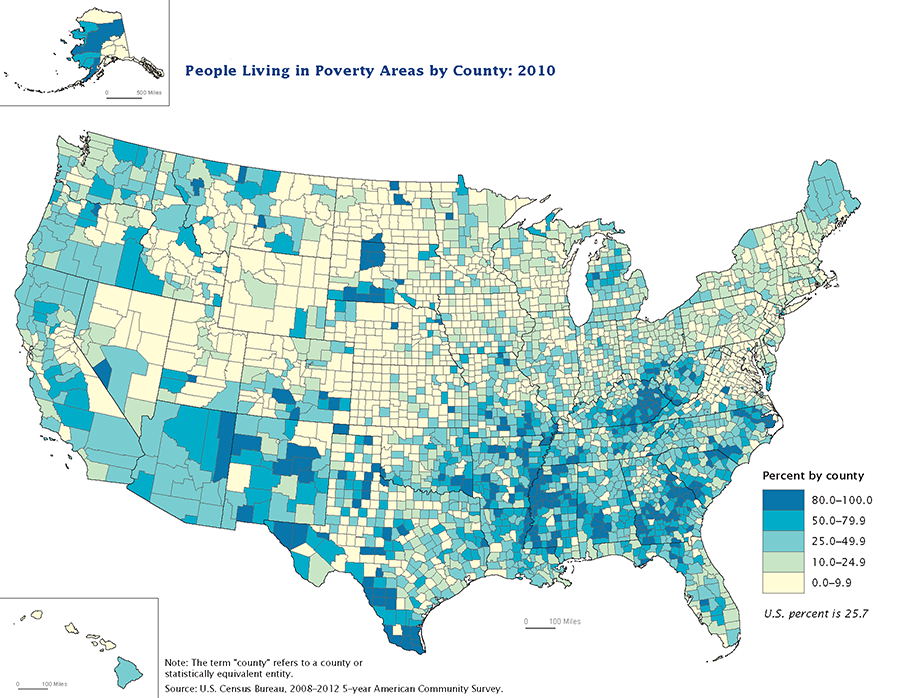
- Many of the counties with 80% or more of the population living in poverty areas were clustered in and around American Indian reservations (in New Mexico, Arizona, South Dakota, and North Dakota) or in the Mississippi Delta region (including portions of Mississippi, Louisiana, and Arkansas).
- About 38% of all families headed by a female householder with no husband present lived in a poverty area — the largest proportion among all family types.
- Blacks, American Indians and Alaska Natives, and those in the “some other race” category were the race groups most likely to live in poverty areas, at 50.4%, 47.8%, and 48.3%, respectively. Whites, however, experienced the largest increase in the proportion living in poverty areas, from 11.3% in 2000 to 20.3% in 2008-2012.
- Employed people saw a larger increase (8.0%) than the unemployed (3.4%) in people living in poverty areas over this period.
- The Midwest region experienced the largest increase over the period (9.8%).