MCDC News and Updates

Story Map

Missouri Accommodations and Food Services Employment Trends

The Accommodation and Food Services employment sector, which includes businesses such as hotels, motels, resorts, restaurants, fast food outlets, cafes, bars, and caterers, plays a vital role in tourism, business travel, and community life. This sector provides essential services to both residents and visitors.

This month’s story map will explore the dynamics of the Accommodation and Food Services workforce across Missouri’s 115 counties over a ten-year period, from 2011 to 2021. The MCDC‘s County Business Patterns collection is the source for this data.

Missouri Census Data Center frequently works with MSDIS on mapping and data projects. MSDIS is a spatial data retrieval and archival system offering many mapping resources, primarily focused on the state of Missouri.

Story Map

Missouri Retail Trade Employment, 2011-2021

Despite changes in the nature of retail jobs in the past decade, a significant portion of Missouri’s working population — more than 25% in some counties — is still employed in the retail sector. This story map explores employment in the retail trade sector in Missouri counties for the 2011-2021 period. The MCDC‘s County Business Patterns collection is the source for this data.

Missouri Census Data Center frequently works with MSDIS on mapping and data projects. MSDIS is a spatial data retrieval and archival system offering many mapping resources, primarily focused on the state of Missouri.

Story Map

Missouri Voter Turnout in General Elections Since 2000 (updated for 2024)

Our story map about Missouri voter turnout by county has been updated to include the November 2024 general election.

The Missouri Census Data Center frequently works with MSDIS on mapping and data projects. MSDIS is a spatial data retrieval and archival system offering many mapping resources, primarily focused on the state of Missouri.

Story Map

The Physiographic Regions of Missouri

The state of Missouri boasts a diverse natural landscape, including vast forests, rolling plains, sprawling river systems, highlands, and swamps. In this month’s story map, MCDC’s partners at the Missouri Spatial Data Information Service (MSDIS) classify these natural features into regions and compare their boundaries to census data provided by MCDC.

Missouri Census Data Center frequently works with MSDIS on mapping and data projects. MSDIS is a spatial data retrieval and archival system offering many mapping resources, primarily focused on the state of Missouri.

Story Map

Missouri County-Level Health Factors

The Missouri Public Health Management System (MOPHIMS) County-Level Study surveys approximately 50,000 Missouri residents to estimate health-related measures throughout the state. Questionnaires gauge behavioral risk factors related to health and document participants’ reports of chronic disease diagnoses.

This month, MCDC’s partners at the Missouri Spatial Data Information Service (MSDIS) present county-level maps showing results of the 2016 study for diabetes, high blood pressure, and kidney disease.

Missouri Census Data Center frequently works with MSDIS on mapping and data projects. MSDIS is a spatial data retrieval and archival system offering many mapping resources, primarily focused on the state of Missouri.

Story Map

Missouri Unemployment Rates, 2020-2021

This December, our partners at the Missouri Spatial Data Information Service (MSDIS) present a swipe map comparing unemployment rates in Missouri counties during the years 2020 and 2021. This is a follow-up to the previous MSDIS map comparing Missouri county unemployment  between 2000 to 2020.

The left side of the swipe map shows unemployment by county for 2020, and the right side shows the rates for 2021.

Missouri Census Data Center frequently works with MSDIS on mapping and data projects. MSDIS is a spatial data retrieval and archival system offering many mapping resources, primarily focused on the state of Missouri.

Story Map

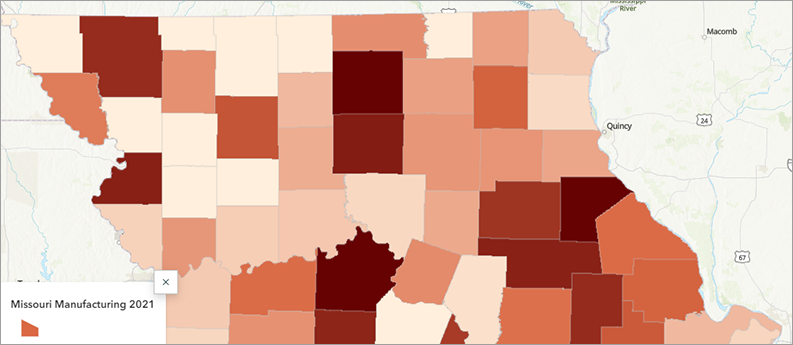
Manufacturing Employment in Missouri over the Past Decade


The manufacturing sector is the fifth largest employer in the United States and the third largest in Missouri (after health care and retail trade). This month, our partners at the Missouri Spatial Data Information Service (MSDIS) examine how manufacturing employment has changed in Missouri counties between 2011 and 2021 using County Business Patterns data from MCDC and the U.S. Census Bureau. These maps show us how important manufacturing is (and isn’t) in certain counties in Missouri.

Missouri Census Data Center frequently works with MSDIS on mapping and data projects. MSDIS is a spatial data retrieval and archival system offering many mapping resources, primarily focused on the state of Missouri.
Story Map

Missouri Unemployment Rates over Time

This month, our partners at the Missouri Spatial Data Information Service (MSDIS) present a swipe map showing changing patterns of unemployment in Missouri across two decades.

The left side of the swipe map shows unemployment rates by Missouri county for 2000, and the right side shows the rates for 2020. Clicking on any county will show basic employment and workforce stats for the selected county and year.

Missouri Census Data Center frequently works with MSDIS on mapping and data projects. MSDIS is a spatial data retrieval and archival system offering many mapping resources, primarily focused on the state of Missouri.

Story Map

Missouri Voter Turnout in General Elections Since 2000 (updated)

Our story map about Missouri voter turnout by county has been updated to include the November 2022 midterm election.

The Missouri Census Data Center frequently works with MSDIS on mapping and data projects. MSDIS is a spatial data retrieval and archival system offering many mapping resources, primarily focused on the state of Missouri.

Story Map

Missouri’s Changing Legislative Boundaries

This month, our partners at the Missouri Spatial Data Information Service (MSDIS) present a set of “swipe maps” showing how the Missouri House and Senate district boundaries changed after the 2020 US Census.

The red outlines on each map (the left side of the swipe tool, in this case) indicate the new, post-2020 districts, and the blue outlines represent the previous boundaries. Clicking on any district will show the district number and, for the newer boundaries, the current office holder.

Missouri Census Data Center frequently works with MSDIS on mapping and data projects. MSDIS is a spatial data retrieval and archival system offering many mapping resources, primarily focused on the state of Missouri.