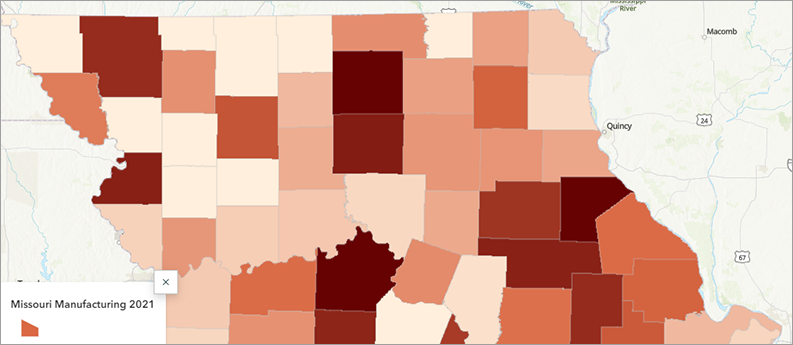
MCDC News and Updates

Story Map

Census 2020 and Missouri’s Changing Population

Last year, the Missouri Spatial Data Information Service (MSDIS) and MCDC brought you several interactive applications that focused on the US Census. We looked at what kinds of public services depend on an accurate census count for the proper distribution of funds and we explored the racial geography of Missouri at a county level. This was all in expectation of the release of the highly anticipated 2020 US Census.

Well, dearest friends and fellow map enthusiasts, the 2020 Census data is here. Let’s have a closer look at Missouri population changes since 2000 and 2010.

Missouri Census Data Center frequently works with MSDIS on mapping and data projects. MSDIS is a spatial data retrieval and archival system offering many mapping resources, primarily focused on the state of Missouri.

Story Map

A Geographic Perspective on Women in Missouri Politics

With this month’s MCDC story map, designed by Abby Hunt, student intern at the Missouri Spatial Data Information Service (MSDIS), we examine which House and Senate districts of the state are represented by women and then consider why certain trends exist.

By reviewing state-level elected offices from a geographic perspective, we can begin to think about the way women influence space and politics. Although legal barriers to running for office may be gone, the glass ceiling is still very much intact when it comes to politics.

Missouri Census Data Center frequently works with MSDIS on mapping and data projects. MSDIS is a spatial data retrieval and archival system offering many mapping resources, primarily focused on the state of Missouri.

Story Map

Missouri Racial Demographics in Census 2010

race map illustration

About a year ago, the Missouri Census Data Center and MSDIS jointly published a story map detailing just a few of the many ways that Missouri benefits from a complete and accurate census. While the official counting period for Census 2020 has only just recently come to a close, we thought it would be interesting to take a look back at what Missouri looked like ten years ago, starting with racial demographics.

The maps in this application show the percentage of each Missouri census tract that identified as White, Black, Hispanic, Asian, American Indian, or Native Hawaiian. Unsurprisingly, the overwhelming majority of our census tracts are primarily occupied with Missourians who identified themselves as White. If you take a moment to compare the different categories, though, some very interesting patterns start to make themselves known.

Missouri Census Data Center frequently works with MSDIS on mapping and data projects. MSDIS is a spatial data retrieval and archival system offering many mapping resources, primarily focused on the state of Missouri.

Story Map

Change in Missouri Voter Turnout, 2000-2016

aerial view of downtown St. Louis

With this month’s MCDC/GRC story map, we explore the changes in voter turnout across the state between presidential elections to shed insight on how Missouri has gone from purple to bright red in just a few short years.

The map, designed by Jefferson Daubitz of the Missouri Spatial Data Information Service (MSDIS), examines the question of who votes, rather than who they vote for. It explores a variable too often ignored in politics — changes in turnout. Each map is fully interactive. Right-click on any county to open a small window that shows the change in voter turnout between each presidential election since 2000.

Missouri Census Data Center frequently works with MSDIS on mapping and data projects. MSDIS is a spatial data retrieval and archival system offering many mapping resources, primarily focused on the state of Missouri.

Story Map

Women’s Role in the Missouri Workforce

Illustration by Ankita Ackroyd-Isales

Although Women’s History Month has come and gone, it is important to continue thinking about the various trends facing women at work. Here, we examine workforce participation. Women’s participation greatly increased throughout the second half of the twentieth century, but beginning in 2000, it began to stagnate and decrease.

This story map, designed by Abby Hunt of the Missouri Spatial Data Information Service (MSDIS), offers a county-level look at female participation in Missouri’s economy.

The Missouri Census Data Center frequently works with MSDIS on mapping and data projects. MSDIS is a spatial data retrieval and archival system offering many mapping resources, primarily focused on the state of Missouri.

Story Map

Missouri and the 2020 Census

2020 will be more than just another new year in the United States. In addition to marking the beginning of a new decade and heralding another presidential election, 2020 will bring with it another decennial census.

What is the census, though? And why is it so important?

Our colleagues at the Missouri Spatial Data Information Service built a story map exploring the 2020 Census and its consequences for Missouri.

The 2020 Census in Missouri

The Missouri Census Data Center frequently works with MSDIS on mapping and data projects. MSDIS is a spatial data retrieval and archival system offering many mapping resources, primarily focused on the state of Missouri.

Story Map

Missouri Voter Turnout in General Elections Since 2000

How many people in Missouri actually exercise their right to vote?

As Missourians get ready to head back to the polls for the 2018 midterm election, our colleagues at the Missouri Spatial Data Information Service built a story map showing voter turnout for previous Missouri general elections from 2000 through 2016.

The Missouri Census Data Center frequently works with MSDIS on mapping and data projects. MSDIS is a spatial data retrieval and archival system offering many mapping resources, primarily focused on the state of Missouri.