MCDC News and Updates

Story Map

Missouri Unemployment Rates, 2020-2021

This December, our partners at the Missouri Spatial Data Information Service (MSDIS) present a swipe map comparing unemployment rates in Missouri counties during the years 2020 and 2021. This is a follow-up to the previous MSDIS map comparing Missouri county unemployment  between 2000 to 2020.

The left side of the swipe map shows unemployment by county for 2020, and the right side shows the rates for 2021.

Missouri Census Data Center frequently works with MSDIS on mapping and data projects. MSDIS is a spatial data retrieval and archival system offering many mapping resources, primarily focused on the state of Missouri.

Story Map

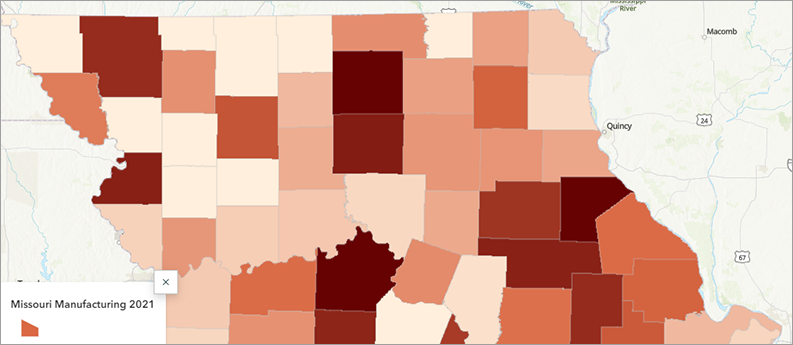
Manufacturing Employment in Missouri over the Past Decade


The manufacturing sector is the fifth largest employer in the United States and the third largest in Missouri (after health care and retail trade). This month, our partners at the Missouri Spatial Data Information Service (MSDIS) examine how manufacturing employment has changed in Missouri counties between 2011 and 2021 using County Business Patterns data from MCDC and the U.S. Census Bureau. These maps show us how important manufacturing is (and isn’t) in certain counties in Missouri.

Missouri Census Data Center frequently works with MSDIS on mapping and data projects. MSDIS is a spatial data retrieval and archival system offering many mapping resources, primarily focused on the state of Missouri.

Data Updates (September 2023)

We have a few routine data and application updates to announce this month.

  • On August 24, we posted new a zcta_master set to our geographic reference data collection. Zcta_master is a comprehensive ZCTA (ZIP Code Tabulation Area) resource with geographic correspondences and vintage 2021 ACS-based demographics. This new version uses ZCTAs as defined for the 2020 census. We have our usual SAS dataset, accessible via the Dexter data extraction tool, as well as a CSV file.
  • We found some minor errors in the new DHC data collection. Tract codes were missing final digits. These have been corrected.
  • Two of our workhorse data applications, uex2dex and Dexter, underwent substantial code updates and revisions.
  • Just this week, we published the 2022-vintage round of intercensal population estimates, released earlier this year. These include the CASRH (characteristics of age, sex, race, and Hispanic origin) data for all states, population ranks, housing unit estimates, and the new “curmoests” Excel file (Missouri current population estimates for the state, counties, subcounty units, and cities and towns).

Please contact the MCDC web manager with any questions or comments.

Story Map

Missouri Unemployment Rates over Time

This month, our partners at the Missouri Spatial Data Information Service (MSDIS) present a swipe map showing changing patterns of unemployment in Missouri across two decades.

The left side of the swipe map shows unemployment rates by Missouri county for 2000, and the right side shows the rates for 2020. Clicking on any county will show basic employment and workforce stats for the selected county and year.

Missouri Census Data Center frequently works with MSDIS on mapping and data projects. MSDIS is a spatial data retrieval and archival system offering many mapping resources, primarily focused on the state of Missouri.

Story Map

Missouri Voter Turnout in General Elections Since 2000 (updated)

Our story map about Missouri voter turnout by county has been updated to include the November 2022 midterm election.

The Missouri Census Data Center frequently works with MSDIS on mapping and data projects. MSDIS is a spatial data retrieval and archival system offering many mapping resources, primarily focused on the state of Missouri.

Story Map

Missouri’s Changing Legislative Boundaries

This month, our partners at the Missouri Spatial Data Information Service (MSDIS) present a set of “swipe maps” showing how the Missouri House and Senate district boundaries changed after the 2020 US Census.

The red outlines on each map (the left side of the swipe tool, in this case) indicate the new, post-2020 districts, and the blue outlines represent the previous boundaries. Clicking on any district will show the district number and, for the newer boundaries, the current office holder.

Missouri Census Data Center frequently works with MSDIS on mapping and data projects. MSDIS is a spatial data retrieval and archival system offering many mapping resources, primarily focused on the state of Missouri.

Story Map

County-to-County Migration in Missouri

This month’s story map, created by Morgan Hurt of the Missouri Spatial Data Information Service, examines recent inward and outward migration to and from Missouri counties.

The data comes from the 2015-2019 American Community Survey — specifically, county-to-county migration flows, a special tabulation created by the ACS program. This data is not released every year, which is why we don’t yet have this migration data from the newest ACS data release (2017-2021).

Missouri Census Data Center frequently works with MSDIS on mapping and data projects. MSDIS is a spatial data retrieval and archival system offering many mapping resources, primarily focused on the state of Missouri.

Story Map

Missouri Median Income vs. Gas Prices

This month’s story map examines trends in Missouri median household income in comparison to gas prices. Data about Missouri income comes from the 2016-2020 American Community Survey via the Missouri Census Data Center, and energy costs data are based off the Consumer Price Index from the United States Bureau of Labor Statistics. County-level gas prices have been taken from the AAA Missouri Gas Prices site, which updates each day.

Missouri Census Data Center frequently works with MSDIS on mapping and data projects. MSDIS is a spatial data retrieval and archival system offering many mapping resources, primarily focused on the state of Missouri.
Story Map

The State of Missouri’s Bridges

According to the  Federal Highway Administration’s National Bridge Inventory, there are about 25,000 bridges in Missouri. Show Me Safe Bridges!, the latest story map from the Missouri Spatial Data Information Service digs into the inventory and maps the best and worst of Missouri’s spans.

Missouri Census Data Center frequently works with MSDIS on mapping and data projects. MSDIS is a spatial data retrieval and archival system offering many mapping resources, primarily focused on the state of Missouri.

Story Map

Missouri Voter Turnout in General Elections Since 2000

How many people in Missouri actually exercise their right to vote?

As Missourians get ready to head back to the polls for the 2022 midterm election, our colleagues at the Missouri Spatial Data Information Service built a story map showing voter turnout for previous Missouri general elections from 2000 through 2020.

The Missouri Census Data Center frequently works with MSDIS on mapping and data projects. MSDIS is a spatial data retrieval and archival system offering many mapping resources, primarily focused on the state of Missouri.