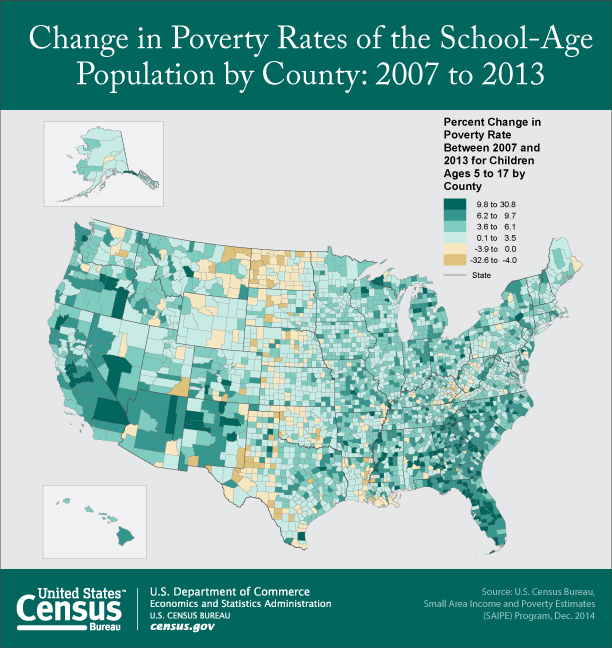
According to U.S. Census Bureau estimates released this week, the poverty rate for school-age children increased in 928 U.S. counties between 2007 and 2013. Fifteen counties showed a decline in poverty rate over the same period, and there was no statistical change in 2,199 counties.
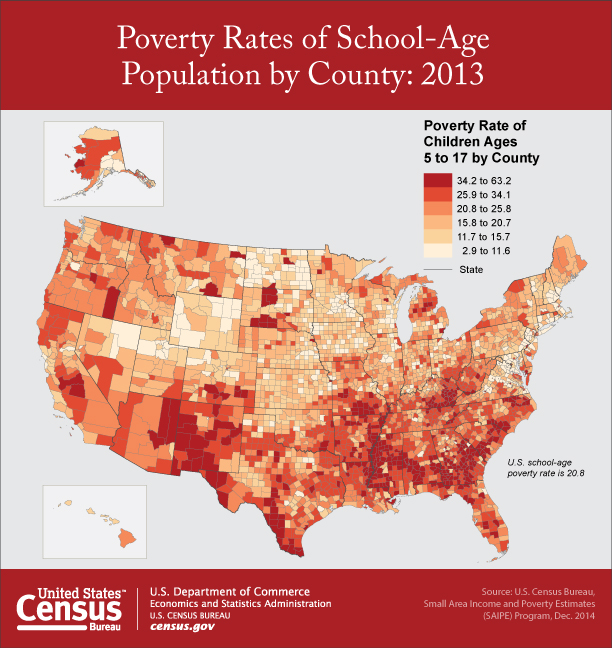
The findings also show there were large concentrations in the South and West of the 972 counties with poverty rates statistically above the national average of 20.8% for school-age children. For example, in New Mexico and Mississippi, more than 80% of counties had poverty rates statistically greater than the national rate. Across the nation, 15% of school districts had poverty rates greater than 30% for school-age children.
Conversely, 902 counties had poverty rates for school-age children that were statistically lower than the national rate. In five states, 80% of counties had rates lower than the national rate: Connecticut, New Hampshire, North Dakota, Rhode Island, and Wyoming.
The statistics are from the Small Area Income and Poverty Estimates (SAIPE) program, which provides the only up-to-date, single-year income and poverty statistics for all counties and school districts — roughly 3,140 counties and nearly 14,000 school districts nationally. Data from the American Community Survey are an important input to these estimates.
The official poverty statistics for the nation were released in the fall of 2014, showing a decline in the poverty rate for children under age 18 from the previous year for the first time since 2000.
About the Small Area Income and Poverty Estimates
The Small Area Income and Poverty Estimates program provides statistics on the total number of people in poverty, the number of children younger than age 5 in poverty (for states only), the number of children ages 5–17 in families in poverty, the number younger than age 18 in poverty, and median household income. At the school district level, estimates are available for the total population, the number of children ages 5–17 and the number of children ages 5–17 in families in poverty. The estimates combine the latest data from the American Community Survey with aggregate data from federal tax records, the Supplemental Nutrition Assistance Program, decennial censuses, and the Population Estimates Program.
This release also includes 2013 Small Area Income and Poverty Estimates (SAIPE): An Overview, which presents income and poverty trends and explains the sources and approach.
Statistics from the SAIPE program are an input to the allocation formula for Title I of the Elementary and Secondary Education Act, which observes its 50th anniversary in April 2015. Title I distributes funding to school districts based on the number and percentage of low-income children. The U.S. Department of Education will use the 2013 estimates to allocate fiscal year 2015 funds for Title I and other Department of Education programs to states and school districts for use primarily in the 2015-2016 school year.