Educational attainment is an established, validated predictor of income. This map-of-the-month series looks at the distribution of both characteristics in Missouri’s counties. Derived from the U.S. Census Bureau, American Community Survey (ACS) 2012-2016 5-year data, Missouri households are mapped here by level of educational attainment and median household income, while a bivariate choropleth map displays the variable impact of earning less than a high school diploma on household income.
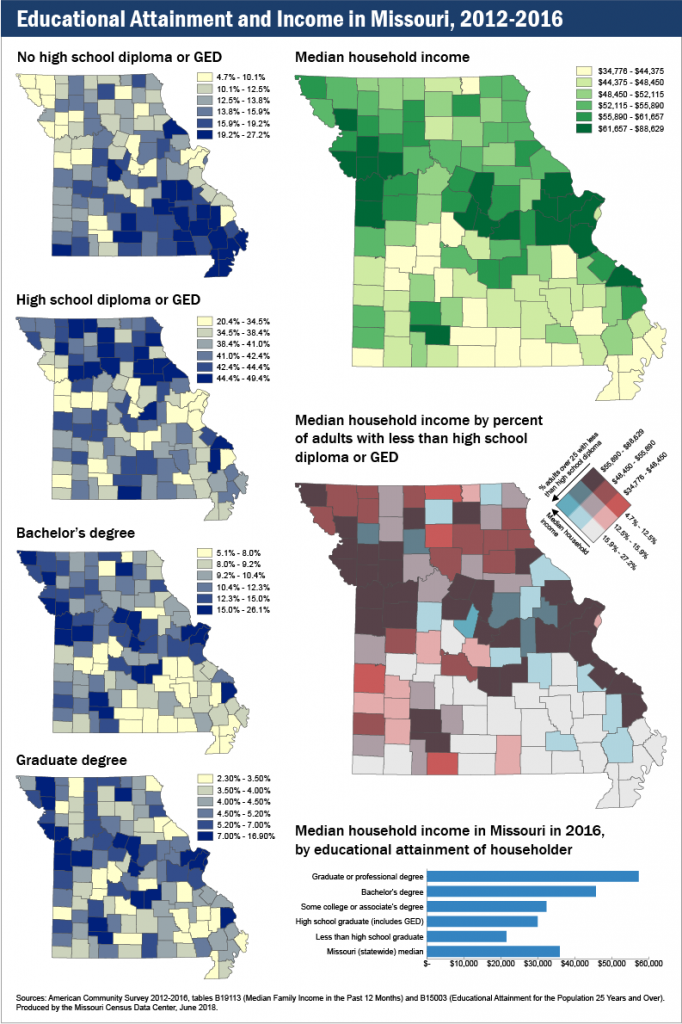
The bar chart, based on the 2016 ACS 1-year release, establishes the relative distribution of median household income by level of education. While the overall median household in Missouri realizes approximately $36,000 in income, the median household in Missouri headed by someone without a high school diploma or GED is closer to $20,000. Completing high school results in a bump of roughly $10,000, with the median household income of high school graduates a little more than $30,000. Completing some college or an associate’s (2-year degree) results in an incremental increase in household median income to the mid-$30,000 range, but it is completion of a bachelor’s degree or greater that accelerates median household income into the mid-$40,000 to mid-$50,000 range annually.
Educational attainment, however, is not the only driver of income. Access to workforce opportunities and proximity to infrastructure impacts potential income too. Review of the Median household income map reveals the influence of infrastructure investment and population density in driving up wages and income, as seen in the counties shaded in the darkest green. It’s also interesting to visually note the geographically layered gradation of quantiles of the state with the I-70 highway corridor connecting Missouri’s relatively high income metropolitan areas, and the agricultural northern tier of counties falling into the mid-quantiles, while lower income households concentrate in the southern tier of counties (with exception of income concentrating in the Springfield metro area).
Not surprisingly, a close look at the concentrations of level of educational attainment (the blue-scale maps), correlate at the county level to the median household income map fairly predictably: Populations with higher concentrations of higher levels of education also have higher median household incomes.
The bivariate choropleth map, Median household income by percent of adults with less than high school diploma or GED, lets us see the outliers as well as validating the correlations we anticipated. For example, the truer the shade of blue a county is coded, the higher the percent of the adult population without a high school diploma/GED and the higher median household income indicating some combination of higher wage job and income opportunities relative to educational qualifications. We see these on the periphery of the other end of the spectrum, counties with higher median household incomes and the lowest rates of households with low educational attainment, suggesting “bedroom” communities. Further study to confirm this pattern might include looking at patterns of in-migration over time and commuting patterns.