MCDC News and Updates

Map of the Month

Renter-Occupied Housing Rates in Missouri Greater than National Rates

August and September mark the period when university students begin their Fall semester classes. These same months also mark the period when college towns across the country see an annual influx of temporary residents. In some cases, the return of college students represents only a minor change in a town’s population. In other cases, however, the result is more dramatic, causing long-time residents and homeowners to feel outnumbered by the sudden increase in short-term occupants. Is that necessarily the case, though?

Renter-occupied housing units in Missouri, 2010

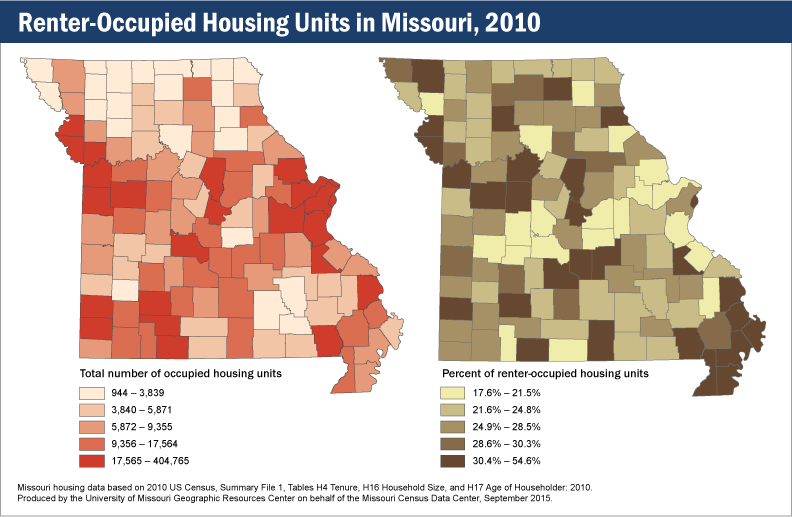
In May 2015, the US Census published a report derived from the 2013 American Housing Survey. The report examined the relationship between owner-occupied housing units and renter-occupied housing units. At the national level, owner-occupied housing units dramatically outnumbered renter-occupied housing (57.0%, compared to just 30.3%). When comparing these national numbers to Missouri’s 2010 Census figures, though, a distinctly different picture forms. All totaled, 28 of Missouri’s 115 counties beat the national percentage for renter-owned housing units. For example, according to the 2010 Census, Boone County — home to the University of Missouri — shows a much more even split between owner-occupied and renter-occupied housing units (56.1% and 43.9%, respectively). Based on the same data, St. Louis City flips the national average completely, with 45.3% of its housing units recorded as owner-occupied, compared to 54.6% recorded as renter-occupied.

Map of the Month

Millennials and Baby Boomers in Missouri

In late June 2015, an news release from the U.S. Census Bureau indicated that, among other distinctions, Millennials — typically identified as persons born between 1982 and 2000 — officially outnumbered Baby Boomers — individuals born between 1946 and 1964. According to the Bureau, not only are Millennials now more numerous than Baby Boomers in the United States, they actually represent more than one quarter of the nation’s population.

Baby boomers and millenials in Missouri, 2013

On a county-by-county basis, Missouri does not follow the national trend. Of Missouri’s 115 counties, only 37 have higher percentages of Millennials than Baby Boomers. Two counties, Webster and St Louis, actually report equal populations of Baby Boomers and Millennials. As can be reasonably expected, most of these younger populations are found in areas of Missouri that include, or are near, metropolitan areas. Kansas City, St Louis City, Springfield, Boone County (and all of its neighboring counties) all possess noticeably more youthful populations than the rest of the state. Although most Missouri counties are estimated to have more Baby Boomers than Millennials, an interesting discovery in the county-level age data is that the difference between the two populations is often very small. Of the 74 counties that have more Baby Boomers than Millennials, only eight counties display a difference between the two populations of 10% or greater.

Map of the Month

Missouri Commuters and Means of Transportation

In April 2015, the U.S. Census Bureau released an infographic comparing the use of alternative transportation across the country. The data, based on the 2013 American Housing Survey, divided the US into four regions — West, Midwest, South, and Northeast — and examined the use of public transportation (buses, commuter trains, subway trains, or commuter vans) by household. Of the four regions, Northeast households recorded the highest use of public transportation at 32%. The Midwest, which includes the state of Missouri, was ranked third of the four regions, with only 12% of households reporting some use of public transportation. In all four regions, local public buses were overwhelmingly the most frequently used type of public transportation.

Commuters and means of transportation in Missouri

The results of these studies are interesting to see on paper, but may not be that surprising to Missouri residents. Being a large, mostly rural state, Missouri simply does not have the same potential for the use of public transportation networks that the smaller, more urbanized states of the Northeast do. That said, not all Missouri commuters drive to work by themselves in their own car or truck. According to the 2009-2013 American Community Survey 5-year estimate of Means of Transportation to Work By Selected Characteristics table (S0802), although the majority of Missourians do drive themselves to work, that behavior tops out only at 87%, and only in two counties — New Madrid and St. Charles. Of the estimated 142,895 commuters in St Louis city, on the other hand, only 71% were believed to drive themselves to work. The lowest rate of commuters driving themselves to work in Missouri was estimated (perhaps unsurprisingly) to be in Pulaski County, at a mere 54%.

Map of the Month

Hospital Availability and Uninsured Population in Missouri

In March 2015, the U.S. Census released the 2013 data collected by the Small Area Health Insurance Estimates Program (SAHIE). The SAHIE data is a valuable reference that provides annual estimates of health insurance coverage for every county in the United States. The 2013 SAHIE data is of particular interest, as that was the last round collected before the first enrollment period of the Affordable Care Act.

Hospital availability and estimated uninsured population in Missouri, 2013

Based on the SAHIE 2013 county-level data, the percentage of uninsured working adults aged 18-64 in Missouri ranged from a low of 11.6% in St. Charles County to a high of 29% in Knox County. This information is interesting in and of itself, as it indicates that no Missouri county had an uninsured working population of 10% or less. When combined with the locations of Missouri hospitals, though, the SAHIE data presents an important lesson.

According to the Missouri Hospital Profiles By Name list, maintained by the Missouri Dept of Health and Senior Services, 41 Missouri counties do not have a hospital within their administrative boundaries. Combining that information with the SAHIE’s estimates reveals that 15 of those counties — Benton, Carter, Daviess, Douglas, Hickory, Knox, McDonald, Morgan, Oregon, Ozark, Schuyler, Shannon, Stone, Webster, and Wright — had uninsured populations between 25.1% and 29% in 2013. Although the list of hospitals does not include smaller facilities (such as rural clinics), this overlap does strongly suggest that some of Missouri’s most medically underserved counties were also home to very high numbers of uninsured working adults.

Reference: U.S. Census report on 2013 SAHIE

Map of the Month

Internet Use and Availability in Missouri

A report published by the U.S. Census Bureau in November 2014, based on the 2013 American Community Survey (ACS), indicated that only 75.6% of Missourians live in households with high-speed Internet use. This figure puts Missouri slightly below the national average of 78.1% and ranks the state fourteenth lowest in high-speed Internet adoption. Additionally, when examining high-speed Internet use within metropolitan areas, several Missouri cities exhibited adoption rates well below the national average of 78.1%. These include St Joseph, Cape Girardeau, Springfield, Joplin, and Jefferson City, which all had adoption rates of less than 73%.

High-speed Internet use vs. availability in Missouri

Although there is no reason to doubt the numbers from the US Census Bureau, it does paint a somewhat incomplete picture of the current state of high-speed internet availability in Missouri. The report focuses on the at-home use of high-speed Internet, rather than availability. This is an important distinction since, based on multiple years of data collection for Missouri’s State Broadband Initiative, evidence suggests that most, if not all, Missourians do have access to high-speed connections from multiple wired and wireless providers.

Reference:  U.S. Census Report on High-Speed Internet Use