MCDC News and Updates

ACS 2016-2020 five-year data release is delayed until March 2022

The U.S. Census Bureau announced on Nov. 10 that the American Community Survey (ACS) 2016-2020 five-year data release will be delayed until March 2022. The ACS normally releases its five-year data products in December of every year. However, according to the Bureau’s statement, “Additional time is needed to continue refining our methodology so that we can minimize the impact of nonresponse bias due to the COVID-19 pandemic.”

This delay will affect several of MCDC’s data applications, notably ACS Profiles, Circular Area Profiles (CAPS ACS), and Missouri County Fact Sheets.

Expect additional updates regarding this matter in December.


Data Updates (September 2021)

Just a couple of late updates this time. They’re late because the raw data was released later than usual due to COVID and the decennial census.

  • NCHS (National Center for Health Statistics) “bridged race” estimates for 2020, including state- and county-level numbers with detail by single years of age, race, sex, and Hispanic origin. These datasets are located in the nchsbri directory of our data archive. Note that we are starting a new decade here, so the new files will contain only the vintage 2020 estimates. Next year’s updates will include 2020 and 2021, and so on for the rest of this decade.
  • New 2020 data for the State/county annual population change, Population trends with demographics, and Population estimates by age applications.

As always, please contact the MCDC website manager with any questions or comments.

Missouri Surpassed 6 Million Persons in the 2010s

The U.S. Census Bureau has published a collection of state population profiles for 2020 as part of its “America Counts” story series.

Missouri now has a population of 6,154,913 and 2,786,621 housing units.

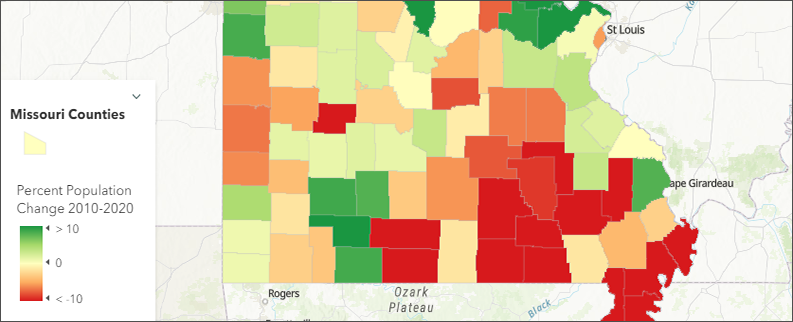
Between 2010 and 2020, Missouri’s population increased by 165,986, or 2.8%. By comparison, the overall U.S. population increase was 7.4%.

Missouri’s under-18 population decreased over the past 10 years by 3.2%, while the adult population increased by 4.6%.

Some key figures about the population of the entire United States, for comparison:

  • Population was up to 331.4 million.
  • The Diversity Index went up to 61.1%, from 54.9%.
  • The under-18 population decreased by 1.4%, and the adult population increased by 10.1%.
  • The number of housing units went up 6.7%, and vacancies went down to 9.7% of all housing units.

Visit the U.S. Census Bureau’s Missouri profile page to learn more.

PL94-171 Redistricting Data is In

The PL94-171 (redistricting) data from the 2020 decennial census is now available in the MCDC data collection.

This is the first major data release of the 2020 Census, comprising race / ethnicity / voting age demographics, along with housing tenure, for all U.S. geographic areas down to the census block level.

MCDC’s new collection (/data/pl942020) includes data for all 50 states, the District of Columbia, and Puerto Rico. The collection contains two datasets per state, one each with totals ([SS]sums) and detail ([SS]detail). The sums datasets will be most useful for our regular users.

According to the U.S. Census Bureau,

Public Law (P.L.) 94-171, enacted by Congress in December 1975, requires the Census Bureau to provide states the opportunity to identify the small area geography for which they need data in order to conduct legislative redistricting. The law also requires the U.S. Census Bureau to furnish tabulations of population to each state, including for those small areas the states have identified, within one year of Census day.

Over the coming days and weeks, we will add more datasets to this collection, including U.S. level and some trends.

For questions or technical assistance, please contact Glenn Rice at MCDC.

Equal Employment Opportunity (EEO) Tables for 2006-2010

MCDC is pleased to announce the debut of the 2006-2010 Equal Employment Opportunity (EEO) Tables in our data archive.

The Census Bureau’s EEO tabulations have served as the primary external benchmark for comparing the race, ethnicity, and sex composition of an organization’s internal workforce, and the analogous external labor market, within a specified geography and job category. These are used by organizations to develop and update their affirmative action plans.

MCDC currently has two sets of Equal Employment Opportunity tabulations (aka EEO tabs) in its data collection. In the next few months, we will be adding the latest EEO tabs (2014-2018) to our collection as well.

As always, please contact the MCDC website manager with any questions or comments.

Data Updates (June 2021)

The Small Area Health Insurance Estimates (SAHIE) program data is now located in its own directory (sahie) in our data archive.

We’ve updated our SAS datasets pertaining to population estimates.

  • Population and components of change estimates: 2020 data added for Missouri and USA. These datasets are located in the popests directory of our data archive. The uscom20 dataset includes estimates of the total population of counties, states, and the US for July 1 of each year from 2010 to 2020, along with annual birth, death, international and domestic migration estimates (the components of change). The ushuest2020 dataset includes estimates of total housing units by county for each year from 2010 through 2020. The ussc20 dataset includes estimates of the total population of places (cities) and other subcounty geographic areas for each year starting with 2010 and ending with 2020. All of these datasets have corresponding Missouri-only versions, e.g. mohuest2020 for MO housing unit estimates.
  • Curmoests (current MO estimates): This Excel spreadsheet includes the latest available (July 1, 2020) population estimates for Missouri counties and places (incorporated cities).

Coming next month:

As always, please contact the MCDC website manager with any questions or comments.

Story Map

A Geographic Perspective on Women in Missouri Politics

With this month’s MCDC story map, designed by Abby Hunt, student intern at the Missouri Spatial Data Information Service (MSDIS), we examine which House and Senate districts of the state are represented by women and then consider why certain trends exist.

By reviewing state-level elected offices from a geographic perspective, we can begin to think about the way women influence space and politics. Although legal barriers to running for office may be gone, the glass ceiling is still very much intact when it comes to politics.

Missouri Census Data Center frequently works with MSDIS on mapping and data projects. MSDIS is a spatial data retrieval and archival system offering many mapping resources, primarily focused on the state of Missouri.

U.S. Census Bureau “Data Gem” offers a quick look at Geocorr

The U.S. Census Bureau’s Census Academy recently released a short video in its “Data Gems” series providing a brief overview about using MCDC’s Geocorr tool to create geographical correspondences. “Whether you are looking for estimates for the nation or a population count for your city block, geography is a critical element to using and accessing Census data. The State Data Center in Missouri [MCDC] developed a great resource to help us work with Census Bureau’s geographies. In this Data Gem, you will learn how to use the Geocorr to identify the geographies that make up your area.”

The Census Academy is the Bureau’s virtual hub for learning data skills, including visualization, population and housing tools, geography, and other topics. The Data Gems are a series of short “how-to” videos for data users looking to quickly enhance census data knowledge.

Story Map

Missouri Racial Demographics in Census 2010

race map illustration

About a year ago, the Missouri Census Data Center and MSDIS jointly published a story map detailing just a few of the many ways that Missouri benefits from a complete and accurate census. While the official counting period for Census 2020 has only just recently come to a close, we thought it would be interesting to take a look back at what Missouri looked like ten years ago, starting with racial demographics.

The maps in this application show the percentage of each Missouri census tract that identified as White, Black, Hispanic, Asian, American Indian, or Native Hawaiian. Unsurprisingly, the overwhelming majority of our census tracts are primarily occupied with Missourians who identified themselves as White. If you take a moment to compare the different categories, though, some very interesting patterns start to make themselves known.

Missouri Census Data Center frequently works with MSDIS on mapping and data projects. MSDIS is a spatial data retrieval and archival system offering many mapping resources, primarily focused on the state of Missouri.