MCDC News and Updates

CAPS 2020 Is Finally Here!

MCDC is pleased to announce the launch of the newest version of our popular CAPS (Circular Area Profiles) applications.

CAPS 2020 is based on our new standard profiles (/data/dhc2020x), created earlier this month from the Demographic and Housing Characteristics (DHC) data from the 2020 decennial census, released in May 2023.

Much like the versions of CAPS based on previous decennial censuses, the new application reports just over 100 key variables (with corresponding percents) from the 2020 DHC file.

Functionally, CAPS 2020 is very similar to the older CAPS applications, although we did a lot of code updates under the hood.

Keen-eyed users may notice that 2010 populations reported by the CAPS 2020 app differ (sometimes significantly) from those reported for the same circles in CAPS 2010. In addition to normal population growth or decline, this is primarily due to the many changes in census geographies (blocks, block groups, and tracts) between 2010 and 2020. There is really no good way around this issue. The 2010 population, and the 2010-to-2020 change/percent change figures should be taken with a grain of salt.

DHC 2020 Standard Extracts Added to MCDC’s Collection

The Missouri Census Data Center has added our “standard extract” data based on the 2020 Demographic and Housing Characteristics (DHC) data. The collection is located in the /data/dhc2020x directory and is also accessible from our data portal page.

This is the collection of standard extracts, where we create a set of just over 100 key variables (with corresponding percents) from the ~9,000 table cells in the complete 2020 DHC file. For each state in the US (plus DC and PR), we have three data sets: one for census blocks, one for complete block groups (summary level 150), and one for “selected inventory” levels: state, county, county subdivision, place (complete and within-county), census tract, and ZIP code (ZCTA). For most geographies, we have added the 2010 population count and used it to calculate change over the decade.

This collection will be the basis for our forthcoming update to the CAPS (Circular Area Profiles) application using 2020 Census data. Users may expect to see the updated CAPS 2020 application in late August 2023.

Demographic and Housing Characteristics Data Added to MCDC’s Collection

The Missouri Census Data Center is pleased to announce that we’ve added the new Demographic and Housing Characteristics (DHC) data to our census data archives. The collection is located in the /data/dhc2020 directory and is also accessible from our data portal page.

The Demographic and Housing Characteristics data was released by the U.S. Census Bureau in May 2023. This is one of the main data products based on the 2020 decennial census.

As in 2010, there was only a short form questionnaire in 2020, so the DHC tables contain just basic demographics (age, sex, race / ethnicity, household types, etc.). The DHC is more or less equivalent to Summary File 1 from the 2010 and earlier censuses, and contains many of the same tables and variables as SF1, although there are some differences.

This data will become the source for MCDC’s DHC standard extract (or “profiles”) — our custom set of key variables for useful geographic area types — which should be ready within a month or so.

Story Map

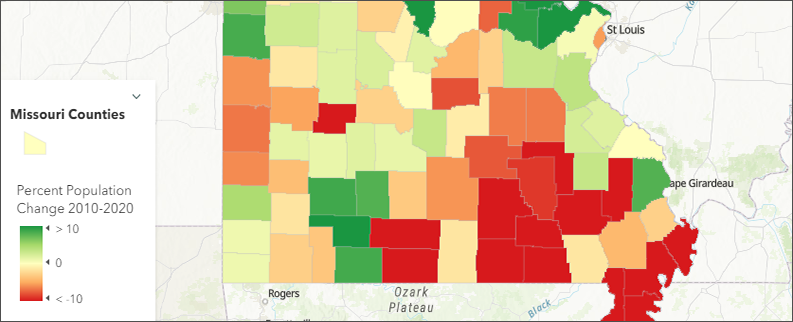
Census 2020 and Missouri’s Changing Population

Last year, the Missouri Spatial Data Information Service (MSDIS) and MCDC brought you several interactive applications that focused on the US Census. We looked at what kinds of public services depend on an accurate census count for the proper distribution of funds and we explored the racial geography of Missouri at a county level. This was all in expectation of the release of the highly anticipated 2020 US Census.

Well, dearest friends and fellow map enthusiasts, the 2020 Census data is here. Let’s have a closer look at Missouri population changes since 2000 and 2010.

Missouri Census Data Center frequently works with MSDIS on mapping and data projects. MSDIS is a spatial data retrieval and archival system offering many mapping resources, primarily focused on the state of Missouri.

Missouri Surpassed 6 Million Persons in the 2010s

The U.S. Census Bureau has published a collection of state population profiles for 2020 as part of its “America Counts” story series.

Missouri now has a population of 6,154,913 and 2,786,621 housing units.

Between 2010 and 2020, Missouri’s population increased by 165,986, or 2.8%. By comparison, the overall U.S. population increase was 7.4%.

Missouri’s under-18 population decreased over the past 10 years by 3.2%, while the adult population increased by 4.6%.

Some key figures about the population of the entire United States, for comparison:

  • Population was up to 331.4 million.
  • The Diversity Index went up to 61.1%, from 54.9%.
  • The under-18 population decreased by 1.4%, and the adult population increased by 10.1%.
  • The number of housing units went up 6.7%, and vacancies went down to 9.7% of all housing units.

Visit the U.S. Census Bureau’s Missouri profile page to learn more.

PL94-171 Redistricting Data is In

The PL94-171 (redistricting) data from the 2020 decennial census is now available in the MCDC data collection.

This is the first major data release of the 2020 Census, comprising race / ethnicity / voting age demographics, along with housing tenure, for all U.S. geographic areas down to the census block level.

MCDC’s new collection (/data/pl942020) includes data for all 50 states, the District of Columbia, and Puerto Rico. The collection contains two datasets per state, one each with totals ([SS]sums) and detail ([SS]detail). The sums datasets will be most useful for our regular users.

According to the U.S. Census Bureau,

Public Law (P.L.) 94-171, enacted by Congress in December 1975, requires the Census Bureau to provide states the opportunity to identify the small area geography for which they need data in order to conduct legislative redistricting. The law also requires the U.S. Census Bureau to furnish tabulations of population to each state, including for those small areas the states have identified, within one year of Census day.

Over the coming days and weeks, we will add more datasets to this collection, including U.S. level and some trends.

For questions or technical assistance, please contact Glenn Rice at MCDC.

Story Map

A Geographic Perspective on Women in Missouri Politics

With this month’s MCDC story map, designed by Abby Hunt, student intern at the Missouri Spatial Data Information Service (MSDIS), we examine which House and Senate districts of the state are represented by women and then consider why certain trends exist.

By reviewing state-level elected offices from a geographic perspective, we can begin to think about the way women influence space and politics. Although legal barriers to running for office may be gone, the glass ceiling is still very much intact when it comes to politics.

Missouri Census Data Center frequently works with MSDIS on mapping and data projects. MSDIS is a spatial data retrieval and archival system offering many mapping resources, primarily focused on the state of Missouri.

Story Map

Change in Missouri Voter Turnout, 2000-2016

aerial view of downtown St. Louis

With this month’s MCDC/GRC story map, we explore the changes in voter turnout across the state between presidential elections to shed insight on how Missouri has gone from purple to bright red in just a few short years.

The map, designed by Jefferson Daubitz of the Missouri Spatial Data Information Service (MSDIS), examines the question of who votes, rather than who they vote for. It explores a variable too often ignored in politics — changes in turnout. Each map is fully interactive. Right-click on any county to open a small window that shows the change in voter turnout between each presidential election since 2000.

Missouri Census Data Center frequently works with MSDIS on mapping and data projects. MSDIS is a spatial data retrieval and archival system offering many mapping resources, primarily focused on the state of Missouri.

Startups Created More Than Two Million Jobs in 2015

In 2015, the nation’s 414,000 startup firms created 2.5 million new jobs, according to data from the Census Bureau’s Business Dynamics Statistics (BDS). This level of startup activity is well below the pre-recession average of 524,000 startup firms and 3.3 million new jobs per year for the period 2002–2006.

Other BDS highlights include:

  • Job creation in the U.S totaled 16.8 million and job destruction totaled 13.7 million, for a net job creation of 3.1 million in 2015.
  • Young firms (those less than six years old) accounted for 11% of employment and 27% of job creation.
  • Old firms (those more than 25 years old) comprised 62% of employment and 48% of job creation.
  • The job creation rate for young firms, excluding startups, was 20% in 2015. This rate is above the Great Recession low of 15% in 2009, and it has recovered to its average level of 20% during the period 2002–2006.
  • The net job creation rate for establishments* in metro areas was 2.7%. For establishments in nonmetro areas, the rate was lower at 1.2%.
  • States with the highest net job creation rates in 2015 — 3.4% and above — are in the South Atlantic, Pacific and Mountain divisions.

The Business Dynamics Statistics are based on Business Register data, which covers all employers in the U.S. private nonfarm economy. This year’s release is limited to 13 tables; this temporary reduction in the number of tables will allow the completion of work to modernize the methodology that generates the Business Dynamics Statistics. The next release, planned for 2018, will provide an expanded set of tables that incorporate long-planned enhancements, including switching from the Standard Industrial Classification system to the North American Industry Classification System.

*A firm is a business organization consisting of one or more establishments under common ownership or control. An establishment is a single physical location where business is conducted or where services or industrial operations are performed. The firm and establishment are the same for single-establishment firms. Startup firms are new firms of age zero. See the BDS concepts and methodology page for definitions of job creation and net job creation rate.

Map of the Month

Selected Characteristics of Veterans in U.S. States

To mark Veteran’s Day this year, the U.S. Census Bureau published infographics detailing a variety of state-level statistically derived characteristics of the men and women who served in the U.S. Armed Forces.  The infographics covered a wide range of topics, including educational attainment, economic circumstances, health care accessibility, age, voting tendencies, and labor force statistics.

Missouri appeared in the middle range in the majority of the featured national statistics when compared to the other states. Specifically, Missouri had 479,828 veterans, with over 35% of those serving in the Vietnam Era. Nearly 50,000 of these veterans owned their own business, and 5.7% were unemployed. The median household income for veterans in Missouri was $54,311.