MCDC News and Updates

Data Updates (Spring 2021)

We’ve updated many of our population-related applications and datasets over the past couple of months.

As always, please contact the MCDC website manager with any questions or comments.

Missouri County Pages Are Back

After a very long hiatus, the application formerly known as “Missouri County Pages” is back in operation. We’re now calling it “Missouri [County] Fact Sheets”, and a few of the old data variables have been replaced. Otherwise, the application has similar appearance and functionality to the old version.

The Missouri Fact Sheets application generates a report for any county in Missouri, including population trends, age and race, income, employment, agriculture, households and housing, poverty, education, and children and families.

See it in action here: http://mcdc.missouri.edu/applications/MO-county-factsheets/.

New Census Estimates Compare School-Age Child Poverty to Prerecession Levels

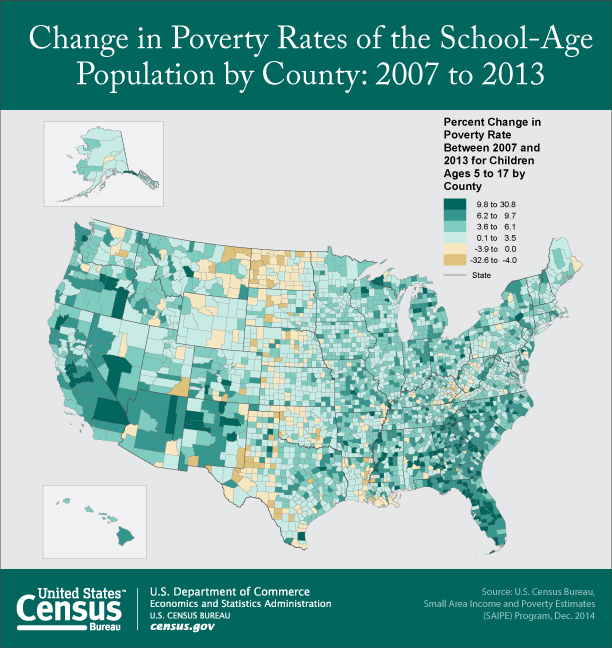
According to U.S. Census Bureau estimates released this week, the poverty rate for school-age children increased in 928 U.S. counties between 2007 and 2013. Fifteen counties showed a decline in poverty rate over the same period, and there was no statistical change in 2,199 counties.

Percent change in poverty rate 2007-2013 for children ages 5-17, by county

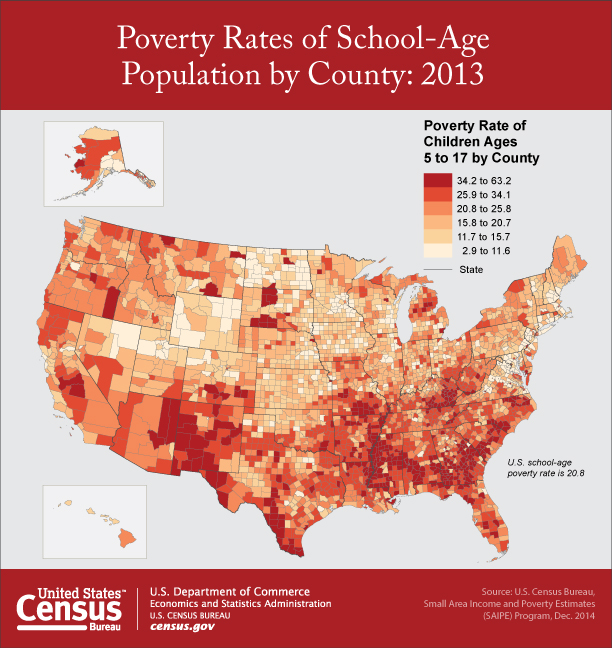
The findings also show there were large concentrations in the South and West of the 972 counties with poverty rates statistically above the national average of 20.8% for school-age children. For example, in New Mexico and Mississippi, more than 80% of counties had poverty rates statistically greater than the national rate. Across the nation, 15% of school districts had poverty rates greater than 30% for school-age children.

Conversely, 902 counties had poverty rates for school-age children that were statistically lower than the national rate. In five states, 80% of counties had rates lower than the national rate: Connecticut, New Hampshire, North Dakota, Rhode Island, and Wyoming.

Poverty rate of children ages 5-17, by county, 2013

The statistics are from the Small Area Income and Poverty Estimates (SAIPE) program, which provides the only up-to-date, single-year income and poverty statistics for all counties and school districts — roughly 3,140 counties and nearly 14,000 school districts nationally. Data from the American Community Survey are an important input to these estimates.

The official poverty statistics for the nation were released in the fall of 2014, showing a decline in the poverty rate for children under age 18 from the previous year for the first time since 2000.

About the Small Area Income and Poverty Estimates

The Small Area Income and Poverty Estimates program provides statistics on the total number of people in poverty, the number of children younger than age 5 in poverty (for states only), the number of children ages 5–17 in families in poverty, the number younger than age 18 in poverty, and median household income. At the school district level, estimates are available for the total population, the number of children ages 5–17 and the number of children ages 5–17 in families in poverty. The estimates combine the latest data from the American Community Survey with aggregate data from federal tax records, the Supplemental Nutrition Assistance Program, decennial censuses, and the Population Estimates Program.

This release also includes 2013 Small Area Income and Poverty Estimates (SAIPE): An Overview, which presents income and poverty trends and explains the sources and approach.

Statistics from the SAIPE program are an input to the allocation formula for Title I of the Elementary and Secondary Education Act, which observes its 50th anniversary in April 2015. Title I distributes funding to school districts based on the number and percentage of low-income children. The U.S. Department of Education will use the 2013 estimates to allocate fiscal year 2015 funds for Title I and other Department of Education programs to states and school districts for use primarily in the 2015-2016 school year.

Census Report

Poverty Rate Declines, Number of Poor Unchanged

The nation’s poverty rate was 15.5% in 2013, down from 16.0% in 2012, according to the supplemental poverty measure released October 16 by the U.S. Census Bureau. The 2013 rate was higher than the official measure of 14.5%, but similarly declined from the corresponding rate in 2012.

Meanwhile, 48.7 million were below the poverty line in 2013 — not statistically different from the number in 2012. In 2013, 45.3 million were poor, using the official definition released in Sept. 2014 in Income and Poverty in the United States: 2013.

These findings are contained in the Census Bureau report The Supplemental Poverty Measure: 2013, released with support from the Bureau of Labor Statistics and describing research showing different ways of measuring poverty in the United States.

The supplemental poverty measure is an effort to take into account many of the government programs designed to assist low-income families and individuals that were not included in the current official poverty measure, released Sept. 16.

While the official poverty measure includes only pretax money income, the supplemental measure adds the value of in-kind benefits, such as the Supplemental Nutrition Assistance Program, school lunches, housing assistance, and refundable tax credits. Additionally, the supplemental poverty measure deducts necessary expenses for critical goods and services from income. Expenses that are deducted include taxes, child care and commuting expenses, out-of-pocket medical expenses, and child support paid to another household.

Estimates for States

The differences between the official and supplemental poverty measures varied considerably by state. The supplemental rates were higher than the official statewide poverty rates in the District of Columbia and 13 states: Alaska, California, Connecticut, Florida, Hawaii, Illinois, Maryland, Massachusetts, Nevada, New Hampshire, New Jersey, New York, and Virginia.

For another 26 states, supplemental rates were lower than the official statewide poverty rates. The states were Alabama, Arkansas, Idaho, Indiana, Iowa, Kansas, Kentucky, Louisiana, Maine, Michigan, Mississippi, Missouri, Montana, Nebraska, New Mexico, North Carolina, North Dakota, Ohio, Oklahoma, South Carolina, South Dakota, Tennessee, Texas, West Virginia, Wisconsin, and Wyoming. Rates in the remaining 11 states were not statistically different using the two measures.

 

ACS Report

One Quarter of U.S. Residents Live in Poverty Areas

A new report from the U.S. Census Bureau’s American Community Survey (ACS) shows that one in four U.S. residents now live in poverty areas — up from fewer than one in five in 2000.

A “poverty area” is defined as any census tract with a poverty rate of 20% or more.

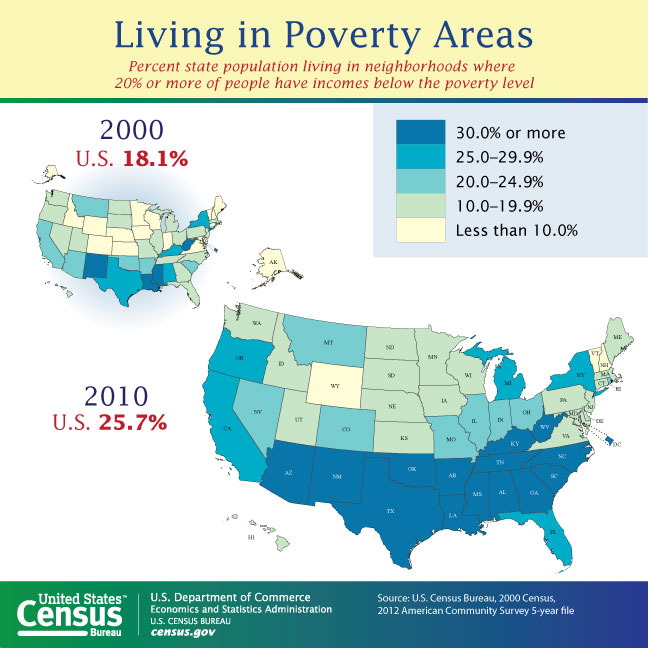
The number of people living in poverty areas increased from 49.5 million (18.0%) in 2000 to 77.4 million (25.7%) in 2008-2012. The overall U.S. poverty rate was 14.9% for the same period.

Percent living in poverty areas by state, 2010

By state, the percentage of people living in a poverty area ranged from 6.8% in New Hampshire to 48.5% in Mississippi. Several states saw declines over the period: District of Columbia (-6.7%), Louisiana (-3.6%), West Virginia (-2.3%), Alaska (-0.4%), Hawaii (-1.0%), and Alaska (-0.4%). On the other hand, North Carolina (17.9%), Oregon (16.0%), Tennessee (16.0%), Arkansas (15.7%), and Georgia (14.6%) had the largest increases in the proportion of people living in poverty areas.

More than half of people living in poverty lived in a poverty area, and about 30% of people living in poverty areas had incomes below the poverty level.

The report, Changes in Areas with Concentrated Poverty: 2000 to 2010, uses data from the 2000 Census and the 2008-2012 ACS five-year estimates to analyze changes in the spatial distribution and socioeconomic characteristics of people living in poverty areas.

According to the report’s author, Alemayehu Bishaw of the Census Bureau’s Poverty Statistics Branch: “Researchers have found that living in poor neighborhoods adds burdens to low-income families, such as poor housing conditions and fewer job opportunities. Many federal and local government agencies use the Census Bureau’s definition of poverty areas to provide much-needed resources to communities with a large concentration of people in poverty.”

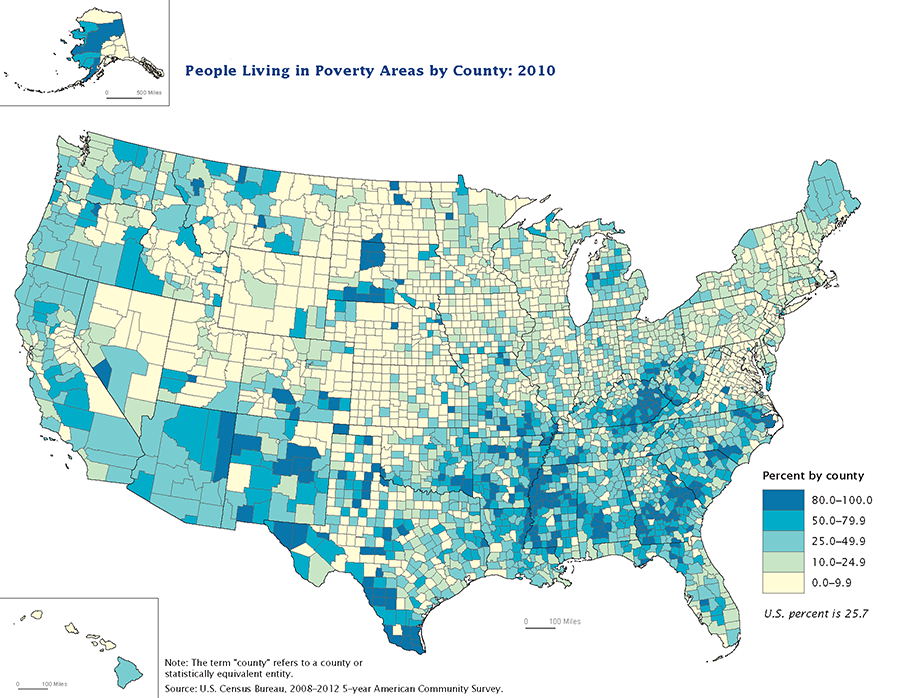
People living in poverty areas by county, 2010

Other highlights of the report:

  • Missouri’s percentage of people living in poverty areas (24.9%) is just slightly lower than the national rate and represents a change of 9.9% over the period.
  • In the 2008-2012 period, in 14 states and D.C., 30% or more of the population lived in poverty areas. In 2000, this was true of four states and D.C.
  • Of the people living in poverty areas in the 2008-2012 period, 51.1% lived in central cities of metro areas, 28.6% in suburbs and 20.4% outside metro areas.
  • Many of the counties with 80% or more of the population living in poverty areas were clustered in and around American Indian reservations (in New Mexico, Arizona, South Dakota, and North Dakota) or in the Mississippi Delta region (including portions of Mississippi, Louisiana, and Arkansas).
  • About 38% of all families headed by a female householder with no husband present lived in a poverty area — the largest proportion among all family types.
  • Blacks, American Indians and Alaska Natives, and those in the “some other race” category were the race groups most likely to live in poverty areas, at 50.4%, 47.8%, and 48.3%, respectively. Whites, however, experienced the largest increase in the proportion living in poverty areas, from 11.3% in 2000 to 20.3% in 2008-2012.
  • Employed people saw a larger increase (8.0%) than the unemployed (3.4%) in people living in poverty areas over this period.
  • The Midwest region experienced the largest increase over the period (9.8%).