MCDC News and Updates

Map of the Month

Educational Attainment in Missouri

Levels of educational attainment play a key role in determining long-term outcomes for individuals, households, communities, and even regional economies. One’s level of education plays an important role in one’s risk for unemployment as well as bounding opportunities for earnings and income.

Educational Attainment in Missouri, 2016

The chart, Unemployment rate and earnings by educational attainment, 2016, from the U.S. Bureau of Labor Statistics captures inverse correlation between risk of unemployment and median earnings by highest level of education achieved. In short, the more education one has, the less likely one is to be unemployed as well as to earn higher median wages. Those with less than a high school diploma are approximately twice as likely or more to be unemployed as those with an associate’s degree or higher, whereas those with an associate’s degree earn a median income that is half as much or less than those with a professional or doctoral degree.

The three maps in this series provide a geographic representation of:

  • less than a high school diploma,
  • a high school diploma, some college with no degree, or an associate’s degree, and
  • a bachelor’s degree or greater

These patterns illustrate the strengths and challenges faced within regions of our state in regard to economic viability, job and employment growth, and workforce readiness.

ACS Report

Nearly 8 in 10 Americans Have Access to High-Speed Internet

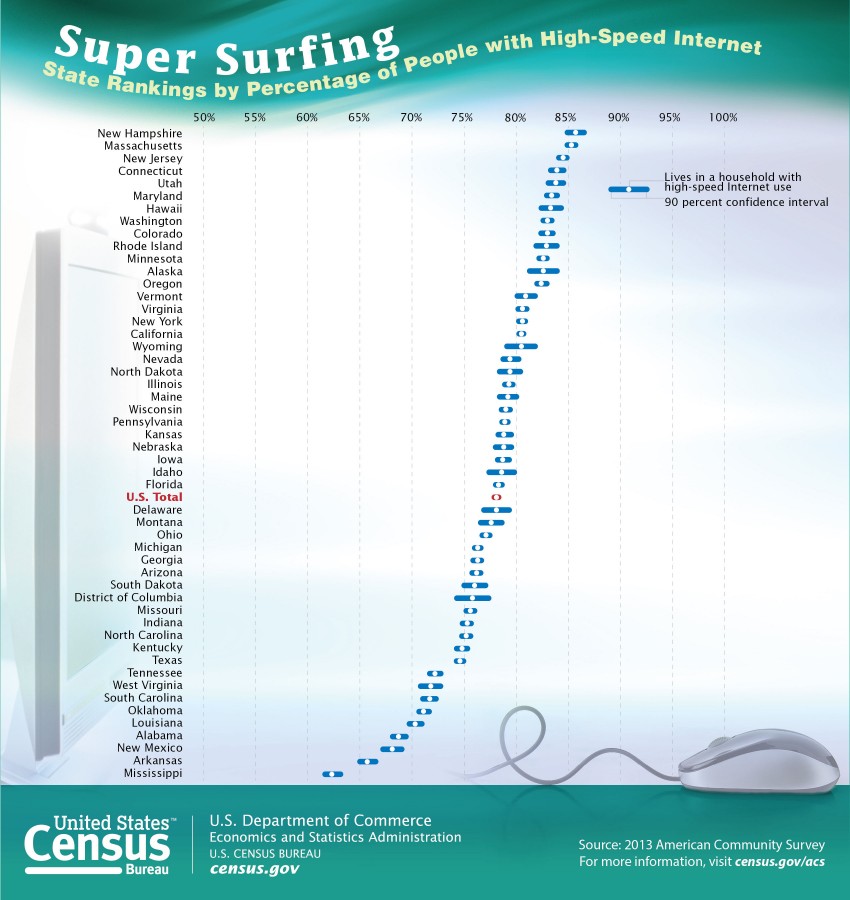
An estimated 78.1% of people in U.S. households had a high-speed Internet connection last year, according to a new report from the U.S. Census Bureau. However, digital divides exist among the nation’s metropolitan areas and demographic groups.

These statistics come from the American Community Survey, which collected data on this topic for the first time in 2013 and is the largest survey used to examine computer and Internet use in the U.S.

Although most Americans have access to computers and high-speed Internet, differences in high-speed Internet use were as large as 25% between certain age and race groups, and divides between specific income and educational attainment groups were as large as 45%. In addition, among the nation’s metro areas, Boulder, Colo., had one of the highest rates of high-speed Internet use at 96.9%, whereas Laredo, Texas, had one of the lowest rates at 69.3%.

The report released in November 2014, Computer and Internet Use in the United States: 2013, includes analysis of household computer ownership and Internet use by age, sex, race and Hispanic origin, income, and education. It covers areas of the country with populations larger than 65,000.

State rankings with percentage of people with high-speed Internet

Metropolitan Areas

The report shows that 75.2% of metropolitan area households reported high-speed Internet use, compared with 63.1% of nonmetropolitan households. In addition, 85.1% of metropolitan households reported owning a computer, compared with 76.5% of nonmetro households.

Some states, such as California, Florida and Washington, had a variety of high- and low-performing areas within their borders — often very near one another. For example, the San Francisco Bay Area of California (including Napa, San Francisco, and San Jose) had high percentages of computer ownership and high-speed Internet use, whereas metropolitan areas in the nearby Central Valley (including Bakersfield, Fresno, and Hanford) had significantly lower estimates on both indicators.

Demographics of Computer and Internet Users

Computer ownership and Internet use were most common in the following types of households:

  • Homes with relatively young householders: 92.5% of homes with a householder age 35–44 reported owning a computer, while 82.5% reported Internet use.
  • In Asian households and white non-Hispanic households: 86.6% of Asian households and 77.4% of white households reported Internet use.
  • In households with high incomes: 98.1% of households making $150,000 or more had a computer, while 94.9% reported Internet use.
  • Householders with high educational attainment: 95.5% of homes with a householder with at least a bachelor’s degree had a computer, while 90.1% reported Internet use.

Connection Type and Access Device

  • The most common household connection type was cable modem (42.8%), followed by mobile broadband (33.1%) and digital subscriber line (DSL) (21.2%).
  • About a quarter of all households had no paid Internet subscription (25.6%).
  • Only 1.0% of all households reported connecting to the Internet using only a dial-up connection.
  • The most common household computer ownership was a desktop or laptop. 63.6% reported a hand-held computer (smartphone or other hand-held wireless computer).

In addition to the report, a series of detailed and profile tables about computer ownership and Internet use are available on the Census Bureau’s website at census.gov. As part of the 2008 Broadband Data Improvement Act, Congress mandated that the Census Bureau begin asking about computer and Internet use in the American Community Survey. Federal agencies will use these statistics to measure the nationwide development of broadband networks and to allocate resources intended to increase access to broadband technologies, particularly among groups with traditionally low levels of access. State and local governments will use these statistics for similar purposes, and businesses and nonprofits will use the information to better serve their communities.

Census Report

10% of Grandparents Live with a Grandchild

Of the 65 million grandparents in the United States in 2012, nearly seven million (10%) lived with at least one grandchild, according to Coresident Grandparents and Their Grandchildren: 2012, a new report from the U.S. Census Bureau.

About 4.2 million households (3% of all households) contained both grandchildren under 18 and their grandparents in 2012. More than 60% of these households were maintained by a grandparent and about one in three had no parent present.

In 2012, 2.7 million grandparents in the U.S. were raising their grandchildren. About 39% of these grandparent caregivers have cared for their grandchildren for five years or more.

The new report uses data from the 2010 Census, the American Community Survey, the Current Population Survey, and the Survey of Income and Program Participation to examine historical changes in coresidence of grandparents and characteristics of grandparents and grandchildren who live together.

Other findings:

  • Grandparents who lived with a grandchild in 2012 were younger, had lower levels of education and were more likely to be in poverty than those who did not live with a grandchild.
  • Two percent of grandparents who lived with a grandchild were age 30–39, whereas the highest percentage was for those age 50–59 (34%). Those age 80 and over made up only 4%.
  • Women comprised 64.2% of grandparents who lived with their grandchildren.
  • Forty-nine percent of children in grandparent-maintained households lived with both grandparents compared with only 19% of children in parent-maintained households.
  • Since 2007, about one-third of children who lived with a grandparent also had two parents present.

New American Community Survey Data Released for 2013

The 2013 American Community Survey (ACS), released today in its one-year version, provides a multitude of statistics that measure the social, economic and housing conditions of U.S. states, counties, and communities. More than 40 topics are available with today’s release, such as educational attainment, housing, employment, commuting, language spoken at home, nativity, ancestry and selected monthly homeowner costs.

The ACS gives communities the current information they need to plan investments and services. Retailers, homebuilders, police departments, and town and city planners are among the many private- and public-sector decision makers who count on these annual results.

“The American Community Survey is our country’s only source of small area estimates for social and demographic characteristics,” Census Bureau Director John H. Thompson said. “As such, it is indispensable to our economic competitiveness and used by businesses, local governments and anyone in need of trusted, timely, detailed data.”

Also released today are two reports providing analysis on income and poverty for states and large metropolitan areas. The ACS three- and five-year data for 2013 will be released in October and December of this year, respectively.

Following are some highlights of the new ACS 2013 one-year release and related reports.

Income

  • For 2013, median household incomes were lower than the U.S. median ($52,250) in 28 states and higher in 19 states and D.C. (Three states did not have a statistically significant difference from the U.S. as a whole.)
  • In 2013, the states with the highest median household incomes were Maryland ($72,483) and Alaska ($72,237). Mississippi had the lowest ($37,963).
  • Median household income among the 25 most populous metro areas was highest in the Washington, D.C. ($90,149), San Francisco ($79,624), and Boston ($72,907) metro areas.

Income Inequality

Household Income: 2013 examined the Gini index for states and large metro areas. The Gini index is a summary measure of income inequality, ranging from 0 (complete equality) to 1 (complete inequality). Among the findings:

  • Five states and D.C. had Gini indexes higher than the U.S. index of .481; 36 states had lower Gini indexes than the U.S.
  • The Gini index of 15 states increased from 2012 to 2013. Alaska was the only state to have a decrease. All other states saw no significant change.
  • The highest Gini index was in the District of Columbia (0.532). Alaska’s (0.408) was among the lowest.

Poverty

  • Two states — New Hampshire and Wyoming — saw a decline in both the number and percentage of people in poverty. New Hampshire’s poverty rate declined from 10% in 2012 to 8.7% in 2013. Wyoming’s rate declined from 12.6% to 10.9%.
  • Three states saw increases in both the number and percentage of people in poverty between 2012 and 2013. New Jersey’s poverty rate increased from 10.8% in 2012 to 11.4% in 2013; New Mexico increased from 20.8% to 21.9%, and Washington increased from 13.5% to 14.1%.
  • In 2013, Mississippi had the highest poverty rate among states (24%), followed by New Mexico (21.9%). Both states also had the highest percentage of the population below 125% of the poverty level: 30.3% in Mississippi and 28.3% in New Mexico. About one in 10 people in both states had incomes less than 50% of the poverty level.
  • Among large metropolitan areas, one of the lowest proportions of people with incomes less than 50% of the poverty level in 2013 was 4.2% in the Washington, D.C., metro area, while one of the highest proportions was 8.4% in the Phoenix metro area.

Health Insurance

  • Between 2012 and 2013, 13 states and Puerto Rico saw a statistically significant increase in the percentage of civilians covered by health insurance. Two states (Maine and New Jersey) saw a decrease.
  • Among people whose incomes were below 138% of the poverty threshold, 25.6% were uninsured in 2013. (Under the Affordable Care Act, states have the option of expanding Medicaid eligibility to those with incomes at or below 138% of the poverty threshold.) Among people whose incomes were at or above 200% of the poverty threshold, 9.2% were uninsured in 2013.
  • Among the top 25 largest U.S. metropolitan areas, the uninsured rates were highest in Miami (24.8%), Houston (22.8%), and Dallas (21.5%) and lowest in Boston (4.2%), Pittsburgh (7.5%), Minneapolis (8.1%), and Baltimore (8.7%).
  • Among the top 25 large metropolitan areas, Tampa, Detroit, and Riverside, Calif., had public coverage rates of 33% or higher.

Computer and Internet Access

The 2013 American Community Survey included new questions to produce statistics on computer and Internet access. Mandated by the 2008 Broadband Data Improvement Act, the data will help the Federal Communications Commission measure broadband access nationwide. The data will also help identify communities eligible for available grants to expand access.

Some findings: 83.8% of the nation’s households have a computer (either desktop, laptop, tablet or smartphone). 74.4% have some form of Internet access at home. The Census Bureau is releasing a more detailed report on the new findings in early October.

Census Report

State of the Nation’s Senior Population

A recent report by the U.S. Census Bureau provides a comprehensive look at the nation’s 40+ million persons aged 65 and older.

The 192-page report, 65+ in the United States: 2010, contains many findings about the senior population on topics such as socioeconomic characteristics, size and growth, geographic distribution, and longevity and health. The report incorporates research from many recent studies that draw heavily from the 2010 Census and nationally representative surveys, such as the Current Population Survey, American Community Survey, and National Health Interview Survey.

Percent seniors in labor force, 2009-2011

Some highlights of the report:

  • Size and growth: In 2010, there were 40.3 million people in the U.S. aged 65 and older — 12 times the number in 1900. Eleven states had more than one million people 65 and older in 2010.
  • Geographic distribution: Florida was among the states with the highest proportions of older people in their populations in 2010, along with West Virginia, Maine, and Pennsylvania (all above 15%). The West and South regions experienced the fastest growth in their 65+ and 85+ populations between 2000 and 2010. Sumter county, Florida — home to a large retirement community — had the nation’s highest median age among all U.S. counties in 2013, at 65.5 years.
  • Elder care: The number of Americans 65+ living in a nursing home fell 20% between 2000 and 2010, from 1.6 million to 1.3 million. Meanwhile, the share in other care settings has been growing. (Economic statistics from the Census Bureau’s 2012 County Business Patterns also show changes in health care-related industries. For example, the number of employees in long-term care facilities grew by about 12% between 2007 and 2012.)
  • Labor force participation: Major retirement destinations, such as Arizona and Florida, had lower 65+ labor force participation rates compared with Midwest states, such as Nebraska, North Dakota, and South Dakota, where a higher share of the older population was still part of the workforce. “In the United States, older men and women are increasingly participating in the labor force,” said Enrique Lamas, the Census Bureau’s associate director for demographic programs.
  • Home ownership: Following 2006 and the peak in housing prices, home ownership rates remained stable for older householders at 81% in 2011, compared with the under-65 population who experienced declines.
  • Employment: Many older workers remained employed during the 2007-2009 recession. 16.2% of the 65+ population were employed in 2010, up from 14.5% in 2005. (By contrast, 60.3% of the 20–24 age group were employed in 2010, down from 68% in 2005.)
  • Internet usage: Between 2000 and 2010, Internet usage for the 65+ population increased from 14.3% to 44.8%.

Percent change in senior population, 2000-2010

Senior poverty, 2010

The Division of Behavioral and Social Research at the National Institute on Aging (NIA) commissioned this report and has also supported three earlier editions, the first published in 1993. “This report series uniquely combines Census Bureau and other federal statistics with findings from NIA-supported studies on aging,” said Richard Suzman, director of the Division of Behavioral and Social Research at NIA. “The collaboration with Census has been of great value in developing social, economic and demographic statistics on our aging population with this edition highlighting an approaching crisis in caregiving — since the baby boomers had fewer children compared to their parents.”