MCDC News and Updates

Equal Employment Opportunity (EEO) Tables for 2006-2010

MCDC is pleased to announce the debut of the 2006-2010 Equal Employment Opportunity (EEO) Tables in our data archive.

The Census Bureau’s EEO tabulations have served as the primary external benchmark for comparing the race, ethnicity, and sex composition of an organization’s internal workforce, and the analogous external labor market, within a specified geography and job category. These are used by organizations to develop and update their affirmative action plans.

MCDC currently has two sets of Equal Employment Opportunity tabulations (aka EEO tabs) in its data collection. In the next few months, we will be adding the latest EEO tabs (2014-2018) to our collection as well.

As always, please contact the MCDC website manager with any questions or comments.

Data Updates (Spring 2021)

We’ve updated many of our population-related applications and datasets over the past couple of months.

As always, please contact the MCDC website manager with any questions or comments.

Missouri County Pages Are Back

After a very long hiatus, the application formerly known as “Missouri County Pages” is back in operation. We’re now calling it “Missouri [County] Fact Sheets”, and a few of the old data variables have been replaced. Otherwise, the application has similar appearance and functionality to the old version.

The Missouri Fact Sheets application generates a report for any county in Missouri, including population trends, age and race, income, employment, agriculture, households and housing, poverty, education, and children and families.

See it in action here: http://mcdc.missouri.edu/applications/MO-county-factsheets/.

Map of the Month

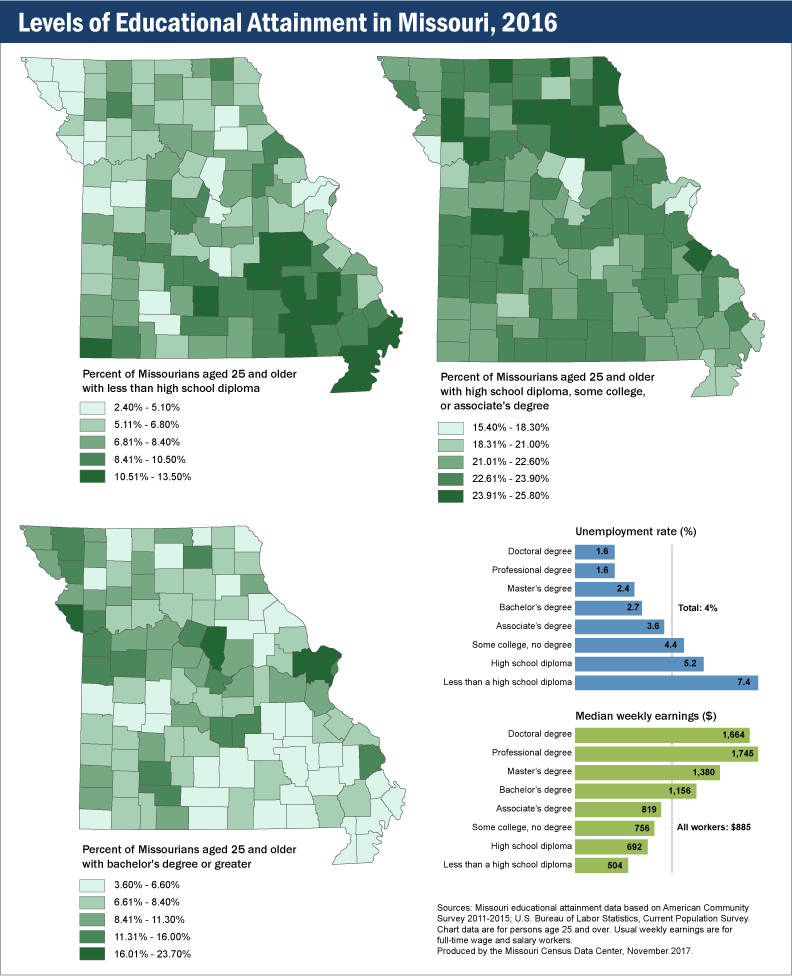
Educational Attainment in Missouri

Levels of educational attainment play a key role in determining long-term outcomes for individuals, households, communities, and even regional economies. One’s level of education plays an important role in one’s risk for unemployment as well as bounding opportunities for earnings and income.

Educational Attainment in Missouri, 2016

The chart, Unemployment rate and earnings by educational attainment, 2016, from the U.S. Bureau of Labor Statistics captures inverse correlation between risk of unemployment and median earnings by highest level of education achieved. In short, the more education one has, the less likely one is to be unemployed as well as to earn higher median wages. Those with less than a high school diploma are approximately twice as likely or more to be unemployed as those with an associate’s degree or higher, whereas those with an associate’s degree earn a median income that is half as much or less than those with a professional or doctoral degree.

The three maps in this series provide a geographic representation of:

  • less than a high school diploma,
  • a high school diploma, some college with no degree, or an associate’s degree, and
  • a bachelor’s degree or greater

These patterns illustrate the strengths and challenges faced within regions of our state in regard to economic viability, job and employment growth, and workforce readiness.

Startups Created More Than Two Million Jobs in 2015

In 2015, the nation’s 414,000 startup firms created 2.5 million new jobs, according to data from the Census Bureau’s Business Dynamics Statistics (BDS). This level of startup activity is well below the pre-recession average of 524,000 startup firms and 3.3 million new jobs per year for the period 2002–2006.

Other BDS highlights include:

  • Job creation in the U.S totaled 16.8 million and job destruction totaled 13.7 million, for a net job creation of 3.1 million in 2015.
  • Young firms (those less than six years old) accounted for 11% of employment and 27% of job creation.
  • Old firms (those more than 25 years old) comprised 62% of employment and 48% of job creation.
  • The job creation rate for young firms, excluding startups, was 20% in 2015. This rate is above the Great Recession low of 15% in 2009, and it has recovered to its average level of 20% during the period 2002–2006.
  • The net job creation rate for establishments* in metro areas was 2.7%. For establishments in nonmetro areas, the rate was lower at 1.2%.
  • States with the highest net job creation rates in 2015 — 3.4% and above — are in the South Atlantic, Pacific and Mountain divisions.

The Business Dynamics Statistics are based on Business Register data, which covers all employers in the U.S. private nonfarm economy. This year’s release is limited to 13 tables; this temporary reduction in the number of tables will allow the completion of work to modernize the methodology that generates the Business Dynamics Statistics. The next release, planned for 2018, will provide an expanded set of tables that incorporate long-planned enhancements, including switching from the Standard Industrial Classification system to the North American Industry Classification System.

*A firm is a business organization consisting of one or more establishments under common ownership or control. An establishment is a single physical location where business is conducted or where services or industrial operations are performed. The firm and establishment are the same for single-establishment firms. Startup firms are new firms of age zero. See the BDS concepts and methodology page for definitions of job creation and net job creation rate.