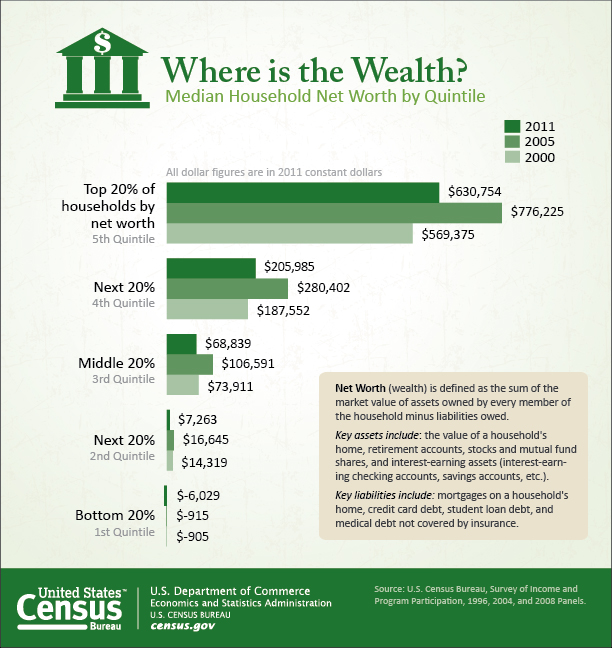
Median net worth increased between 2000 and 2011 for households in the top two quintiles of the net worth distribution — the wealthiest 40% of households — while declining for those in the lower three quintiles, according to statistics released recently by the U.S. Census Bureau. (Each quintile represents 20%, or one fifth, of all households.) The result: A widening wealth gap between those at the top and those in the middle and bottom of the net worth distribution.

According to the report, Distribution of Household Wealth in the U.S.: 2000 to 2011, median household net worth decreased by $5,124 for households in the lowest-net-worth quintile and increased by $61,379 (10.8%) for those in the highest quintile. Median net worth of households in the highest quintile was 39.8 times higher than the second lowest quintile in 2000, and it rose to 86.8 times higher in 2011.
The report also details a widening of the wealth gap for households sharing the same demographic characteristics, such as age, race and Hispanic origin, and educational attainment of the householder. For example, the median net worth for non-Hispanic whites in the highest quintile was 21.8 times higher than for those in the second-lowest quintile in 2000; in 2011, this had increased to 31.5 times higher. For blacks, the ratio increased from 139.9 to 328.1, and for Hispanics, the increase was from 158.4 to 220.9.
Between 2000 and 2011, the wealth gap has also widened between groups with different demographic characteristics. For example, the ratio of median net worth of non-Hispanic whites to that of blacks rose from 10.6 to 17.5 between 2000 and 2011, and the ratio of non-Hispanic whites to Hispanics also increased from 8.1 to 14.4.
“However, when looking at the highest quintile for these groups, we see that blacks experienced higher relative increases in median net worth than non-Hispanic whites and Hispanics,” Census Bureau economist Marina Vornovitsky said. For blacks in the highest quintile, median net worth increased by 62.8%, to $229,041; for Hispanics in the highest quintile, it increased by 17.9% to $250,462, and for non-Hispanic whites in the highest quintile, it rose by 11.9% to $754,244.
The Distribution of Household Net Worth and Debt in the U.S. detailed table packages were released for 2000, 2002, 2004, 2005, 2009, 2010 and 2011, the years for which data were collected.


