MCDC News and Updates

ACS 2019-2023 and Other Data Updates (December 2024)

Just in time for the end of the year, we have many small and large data updates to announce. The big one, of course, is the 2019-2023 ACS five-year data collection, released just this month. MCDC uses the five-year ACS data for many products and apps, including:

In the area of population estimates, we recently added the 2010-2019 intercensal population and housing unit estimates, released in November 2024. These estimates, produced each decade by the U.S. Census Bureau’s Population Estimates Program, adjust the existing time series of postcensal estimates for a full decade to smooth the transition from one decennial census count to the next. We have SAS datasets of national files covering the nation, states, counties, places, and subcounty areas. The MCDC data collection now includes a new subdirectory (/popests/intrcensl/) devoted to these datasets.

Other recent, smaller data updates include:

Please contact the MCDC web manager with any questions or comments.

DHC 2020 Profiles Applications

MCDC has added two new web applications for browsing the 2020 Census Demographic and Housing Characteristics (DHC) data.

In August 2023, we posted our “standard extracts” (also called profiles) of the DHC data — a set of just over 100 key variables from the ~9,000 table cells in the complete 2020 DHC file. This collection is located in the /data/dhc2020x directory and is also accessible from our data portal page.

The two new web apps facilitate browsing and extracting data from the profiles. The Census 2020 DHC Extract Assistant is a portal for accessing the collection of SAS datasets linked above. Essentially, it’s a easy-to-use, menu-driven front end for the Dexter data extractor, customized for the DHC Profiles collection. Users may use basic presets, or select the “advanced” option to pass through to the standard Dexter form for additional filters. The application can output web tables, CSV files, PDFs, SAS, and DBF data files.

The Census 2020 Profile Report application offers a simple interface for selecting up to four areas and generating a report listing all of the DHC profile values for each selected area. This is the easiest option for quick results.

Geographic coverage for both apps includes:

  • Census regions
  • Census divisions
  • States
  • Counties
  • Minor civil divisions (county subdivisions)
  • Places (cities, towns)
  • Metropolitan/micropolitan statistical areas
  • Census tracts
  • Census block groups
  • Census blocks
  • Urban areas (complete and state portions)
  • Congressional districts (118th Congress)
  • State senate districts
  • State house districts
  • Public use microdata areas (PUMAs)
  • ZIP Codes (ZCTAs) within state
  • Elementary school districts
  • Secondary school districts
  • Unified school districts

Geocorr and Other Application Updates (December 2023)

MCDC has a number of significant application updates to announce this month.

We added several new geography types to the Geocorr 2022 application, including the new core-based statistical areas (CBSAs, which include metropolitan and micropolitan statistical areas), metropolitan divisions, and combined statistical areas (CSAs), all of which were released by the Office of Management and Budget in July 2023. We also added the “new” Connecticut planning regions, and updated the urban areas to match those currently used by the Census Bureau.

The Connecticut planning regions pose a special problem for those using Geocorr to do county-level correlations. Earlier this year, the State of Connecticut finalized adoption of the State’s nine Councils of Governments (COGs), also called planning regions, as the county-equivalent geographic unit. Unfortunately for longitudinal county-level data users, the new regions don’t match the boundaries of the state’s eight counties that were previously used for census data tabulation.

In Geocorr, we’ve designated the planning regions as a new geography type that exists only in Connecticut. The unwanted consequence is that if you try to run a correlation using the new planning regions with any state besides CT, you’ll get an error. Thus, if you want to run a county-to-target correlation for many states or the whole nation, you’ll need to run it twice: once with all the states except CT, and then a second run to do the region-to-target correlation just for CT.

For more information about the CT changes, see Final Change to County Equivalents in Connecticut and the Final Federal Register Notice, Change to County Equivalents in the State of Connecticut.

Two other MCDC data applications have also been extensively updated: Population Estimates by Age and Population Trends with Demographics. The earlier versions of these apps relied on the so-called “bridged-race” single-year-of-age data from the National Center for Health Statistics (NCHS). Unfortunately, this very valuable data source was discontinued in 2020. These applications now use the annual population estimates published by the Census Bureau’s Population Estimates Program. Rather than single-year-of-age data, these estimates are aggregated into 18 five-year age “buckets” or cohorts. Therefore, it’s no longer possible to extract single years of age or make custom cohorts with the MCDC apps. Moreover, the census race classifications changed in 2000. Before then, there was not a separate race category for “Hawaiian and other Pacific Islander”. These populations were included in the “Asian” category prior to 2000. In addition, there was no category for “Two or more races” before 2000. Please exercise due caution when using pre-2000 population estimates from our applications and from the Census Bureau sources.

Please contact the MCDC web manager with any questions or comments.

Data Updates (September 2023)

We have a few routine data and application updates to announce this month.

  • On August 24, we posted new a zcta_master set to our geographic reference data collection. Zcta_master is a comprehensive ZCTA (ZIP Code Tabulation Area) resource with geographic correspondences and vintage 2021 ACS-based demographics. This new version uses ZCTAs as defined for the 2020 census. We have our usual SAS dataset, accessible via the Dexter data extraction tool, as well as a CSV file.
  • We found some minor errors in the new DHC data collection. Tract codes were missing final digits. These have been corrected.
  • Two of our workhorse data applications, uex2dex and Dexter, underwent substantial code updates and revisions.
  • Just this week, we published the 2022-vintage round of intercensal population estimates, released earlier this year. These include the CASRH (characteristics of age, sex, race, and Hispanic origin) data for all states, population ranks, housing unit estimates, and the new “curmoests” Excel file (Missouri current population estimates for the state, counties, subcounty units, and cities and towns).

Please contact the MCDC web manager with any questions or comments.

CAPS 2020 Is Finally Here!

MCDC is pleased to announce the launch of the newest version of our popular CAPS (Circular Area Profiles) applications.

CAPS 2020 is based on our new standard profiles (/data/dhc2020x), created earlier this month from the Demographic and Housing Characteristics (DHC) data from the 2020 decennial census, released in May 2023.

Much like the versions of CAPS based on previous decennial censuses, the new application reports just over 100 key variables (with corresponding percents) from the 2020 DHC file.

Functionally, CAPS 2020 is very similar to the older CAPS applications, although we did a lot of code updates under the hood.

Keen-eyed users may notice that 2010 populations reported by the CAPS 2020 app differ (sometimes significantly) from those reported for the same circles in CAPS 2010. In addition to normal population growth or decline, this is primarily due to the many changes in census geographies (blocks, block groups, and tracts) between 2010 and 2020. There is really no good way around this issue. The 2010 population, and the 2010-to-2020 change/percent change figures should be taken with a grain of salt.

DHC 2020 Standard Extracts Added to MCDC’s Collection

The Missouri Census Data Center has added our “standard extract” data based on the 2020 Demographic and Housing Characteristics (DHC) data. The collection is located in the /data/dhc2020x directory and is also accessible from our data portal page.

This is the collection of standard extracts, where we create a set of just over 100 key variables (with corresponding percents) from the ~9,000 table cells in the complete 2020 DHC file. For each state in the US (plus DC and PR), we have three data sets: one for census blocks, one for complete block groups (summary level 150), and one for “selected inventory” levels: state, county, county subdivision, place (complete and within-county), census tract, and ZIP code (ZCTA). For most geographies, we have added the 2010 population count and used it to calculate change over the decade.

This collection will be the basis for our forthcoming update to the CAPS (Circular Area Profiles) application using 2020 Census data. Users may expect to see the updated CAPS 2020 application in late August 2023.

Demographic and Housing Characteristics Data Added to MCDC’s Collection

The Missouri Census Data Center is pleased to announce that we’ve added the new Demographic and Housing Characteristics (DHC) data to our census data archives. The collection is located in the /data/dhc2020 directory and is also accessible from our data portal page.

The Demographic and Housing Characteristics data was released by the U.S. Census Bureau in May 2023. This is one of the main data products based on the 2020 decennial census.

As in 2010, there was only a short form questionnaire in 2020, so the DHC tables contain just basic demographics (age, sex, race / ethnicity, household types, etc.). The DHC is more or less equivalent to Summary File 1 from the 2010 and earlier censuses, and contains many of the same tables and variables as SF1, although there are some differences.

This data will become the source for MCDC’s DHC standard extract (or “profiles”) — our custom set of key variables for useful geographic area types — which should be ready within a month or so.

Map of the Month

Housing-Cost-Burdened Households Across Missouri

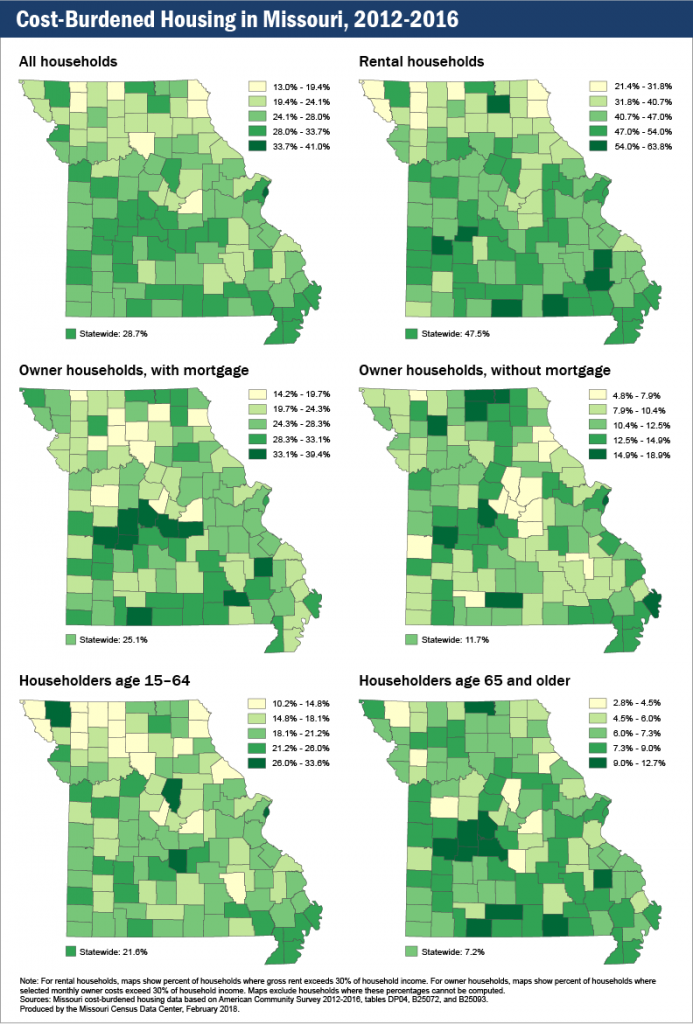
The U.S. Census Bureau, in partnership with the federal department of Housing and Urban Development (HUD), calculate a measure of the percent of household gross income committed to paying for basic housing costs. If more than 30% of household gross income is spent on housing costs, a household is considered housing-cost burdened. The definition of cost burden considers monthly rental fees and utilities for rental housing and mortgage payments, second mortgage payments, utilities, real estate taxes, association fees, and homeowner’s insurance for owner-occupied households.

The concept of measuring a housing-cost burden emerged as a policy indicator during the implementation of the United State Housing Act of 1937 and has been used as a tool to understand trends in housing affordability trends since. Initially, a household was considered cost burdened if spending greater than 20% of household income on housing costs. The policy definition of cost burden has evolved over time. The currently used 30% was adopted in the early 1980s by HUD and has been used as a tool to inform both mortgage-lending policy as well as policy regarding supports for low-income, subsidized housing. Households paying greater than 50% of their gross income for housing are considered severely housing-cost burdened. The paper “Who Can Afford to Live in a Home”, published by the U.S. Census Bureau in 2006, provides a policy history and discussions of methodology and interpretation that remain useful.

The U.S. Census Bureau publishes 1- and 5-year estimates of this indicator with counties with populations of 60,000+ receiving annual estimates and smaller-population counties an annual 5-year estimate. In order to compare all Missouri counties, these maps consider the most recent 5-year estimate from 2012-2016. To understand the impact of housing-cost burdened households on Missouri’s communities, we have created six maps that consider:

  • all households,
  • rental households,
  • owner-occupied households with a mortgage,
  • owner-occupied households without a mortgage,
  • households headed by those under age 65, and
  • households headed by those age 65 and older.

Cost-Burdened Housing in Missouri, 2012-2016

Approximately 30% of all Missouri households fall into the category of housing-cost burdened, spending 30% or more of gross income on housing costs. Nearly 50% of households that rent are housing-cost burdened, whereas a quarter of owner-occupied households making a mortgage payment are similarly cost burdened.

Approximately one in five households led by householders younger than 65 are cost burdened, and approximately 7% of senior householders fall into this category.

A careful consideration of these maps provides some surprises to the conventional wisdom that housing costs tend to be greater in higher-population-density areas. It’s important to keep in mind that the housing-cost burdened indicator is measuring the ratio of household income required for shelter to what is available for other household needs. Simply, whereas housing costs and values do tend to be higher in more population-dense areas, wages tend to be too. When considering the distribution by quintiles across Missouri counties, generally, southern Missouri households are more likely to be cost burdened compared to their rural northern Missouri neighbors. As a region, the Lake of the Ozarks/Truman Lake area is the densest area of cost-burdened owner-occupied housing as well as senior housing, at least partially accounted for by the region’s desirability as a retirement and/or second home destination. For seniors, the Branson area also has a high percent of both senior and renter households paying 30% or more of their gross household income on housing costs. The I-70 corridor, including Kansas City, Columbia, and the St. Louis metropolitan area tends to be most expensive for renters and households under 65.

Map of the Month

Renter-Occupied Housing Rates in Missouri Greater than National Rates

August and September mark the period when university students begin their Fall semester classes. These same months also mark the period when college towns across the country see an annual influx of temporary residents. In some cases, the return of college students represents only a minor change in a town’s population. In other cases, however, the result is more dramatic, causing long-time residents and homeowners to feel outnumbered by the sudden increase in short-term occupants. Is that necessarily the case, though?

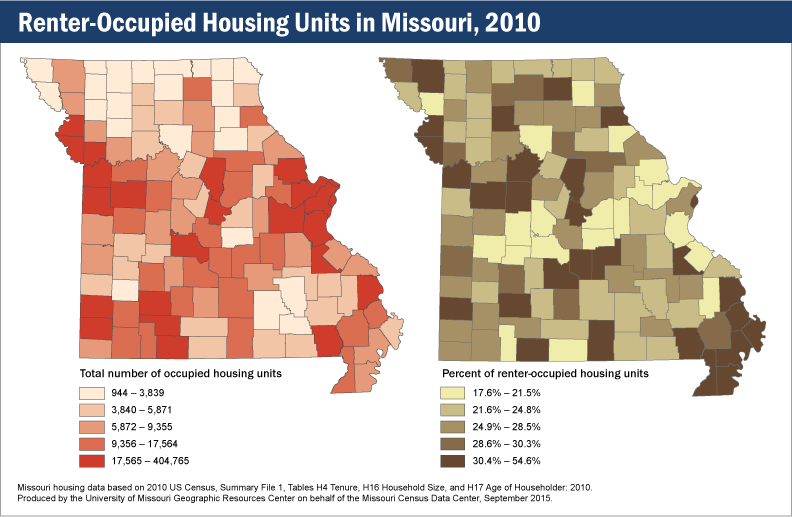
Renter-occupied housing units in Missouri, 2010

In May 2015, the US Census published a report derived from the 2013 American Housing Survey. The report examined the relationship between owner-occupied housing units and renter-occupied housing units. At the national level, owner-occupied housing units dramatically outnumbered renter-occupied housing (57.0%, compared to just 30.3%). When comparing these national numbers to Missouri’s 2010 Census figures, though, a distinctly different picture forms. All totaled, 28 of Missouri’s 115 counties beat the national percentage for renter-owned housing units. For example, according to the 2010 Census, Boone County — home to the University of Missouri — shows a much more even split between owner-occupied and renter-occupied housing units (56.1% and 43.9%, respectively). Based on the same data, St. Louis City flips the national average completely, with 45.3% of its housing units recorded as owner-occupied, compared to 54.6% recorded as renter-occupied.

New American Community Survey Data Released for 2013

The 2013 American Community Survey (ACS), released today in its one-year version, provides a multitude of statistics that measure the social, economic and housing conditions of U.S. states, counties, and communities. More than 40 topics are available with today’s release, such as educational attainment, housing, employment, commuting, language spoken at home, nativity, ancestry and selected monthly homeowner costs.

The ACS gives communities the current information they need to plan investments and services. Retailers, homebuilders, police departments, and town and city planners are among the many private- and public-sector decision makers who count on these annual results.

“The American Community Survey is our country’s only source of small area estimates for social and demographic characteristics,” Census Bureau Director John H. Thompson said. “As such, it is indispensable to our economic competitiveness and used by businesses, local governments and anyone in need of trusted, timely, detailed data.”

Also released today are two reports providing analysis on income and poverty for states and large metropolitan areas. The ACS three- and five-year data for 2013 will be released in October and December of this year, respectively.

Following are some highlights of the new ACS 2013 one-year release and related reports.

Income

  • For 2013, median household incomes were lower than the U.S. median ($52,250) in 28 states and higher in 19 states and D.C. (Three states did not have a statistically significant difference from the U.S. as a whole.)
  • In 2013, the states with the highest median household incomes were Maryland ($72,483) and Alaska ($72,237). Mississippi had the lowest ($37,963).
  • Median household income among the 25 most populous metro areas was highest in the Washington, D.C. ($90,149), San Francisco ($79,624), and Boston ($72,907) metro areas.

Income Inequality

Household Income: 2013 examined the Gini index for states and large metro areas. The Gini index is a summary measure of income inequality, ranging from 0 (complete equality) to 1 (complete inequality). Among the findings:

  • Five states and D.C. had Gini indexes higher than the U.S. index of .481; 36 states had lower Gini indexes than the U.S.
  • The Gini index of 15 states increased from 2012 to 2013. Alaska was the only state to have a decrease. All other states saw no significant change.
  • The highest Gini index was in the District of Columbia (0.532). Alaska’s (0.408) was among the lowest.

Poverty

  • Two states — New Hampshire and Wyoming — saw a decline in both the number and percentage of people in poverty. New Hampshire’s poverty rate declined from 10% in 2012 to 8.7% in 2013. Wyoming’s rate declined from 12.6% to 10.9%.
  • Three states saw increases in both the number and percentage of people in poverty between 2012 and 2013. New Jersey’s poverty rate increased from 10.8% in 2012 to 11.4% in 2013; New Mexico increased from 20.8% to 21.9%, and Washington increased from 13.5% to 14.1%.
  • In 2013, Mississippi had the highest poverty rate among states (24%), followed by New Mexico (21.9%). Both states also had the highest percentage of the population below 125% of the poverty level: 30.3% in Mississippi and 28.3% in New Mexico. About one in 10 people in both states had incomes less than 50% of the poverty level.
  • Among large metropolitan areas, one of the lowest proportions of people with incomes less than 50% of the poverty level in 2013 was 4.2% in the Washington, D.C., metro area, while one of the highest proportions was 8.4% in the Phoenix metro area.

Health Insurance

  • Between 2012 and 2013, 13 states and Puerto Rico saw a statistically significant increase in the percentage of civilians covered by health insurance. Two states (Maine and New Jersey) saw a decrease.
  • Among people whose incomes were below 138% of the poverty threshold, 25.6% were uninsured in 2013. (Under the Affordable Care Act, states have the option of expanding Medicaid eligibility to those with incomes at or below 138% of the poverty threshold.) Among people whose incomes were at or above 200% of the poverty threshold, 9.2% were uninsured in 2013.
  • Among the top 25 largest U.S. metropolitan areas, the uninsured rates were highest in Miami (24.8%), Houston (22.8%), and Dallas (21.5%) and lowest in Boston (4.2%), Pittsburgh (7.5%), Minneapolis (8.1%), and Baltimore (8.7%).
  • Among the top 25 large metropolitan areas, Tampa, Detroit, and Riverside, Calif., had public coverage rates of 33% or higher.

Computer and Internet Access

The 2013 American Community Survey included new questions to produce statistics on computer and Internet access. Mandated by the 2008 Broadband Data Improvement Act, the data will help the Federal Communications Commission measure broadband access nationwide. The data will also help identify communities eligible for available grants to expand access.

Some findings: 83.8% of the nation’s households have a computer (either desktop, laptop, tablet or smartphone). 74.4% have some form of Internet access at home. The Census Bureau is releasing a more detailed report on the new findings in early October.